Introduction
We have all heard the positive sounding news: fourth quarter revenues of US$362 million, a 121% increase from third quarter of 2014; contract sales of $402 million, which is a 140% increase from the third quarter of 2014. These numbers are really a testimony to just how bad the Chinese real estate market was the third quarter.
The annual headline comparisons are a bit more sobering than the quarterly comparisons: revenues up only 2.5% to $920 million in 2014 and floor area sales down 5.5% to 629,000 square meters. We then get to the important number for shareholders: net income down 61% from $126 million in 2013 to $48 million in 2014.
In my last piece on Xinyuan (XIN), I posed several questions that the 4th quarter results would help to clarify. That data is now available. In what follows, I use the latest data to address questions regarding the future economic well-being of the company.
Real estate involves borrowing money to buy land and building properties. Profits depend on selling for more than the cost of the land and properties built. Profit growth depends on holding costs down and while selling more and increasing the property/building inventory.
a. Inventories and Sales
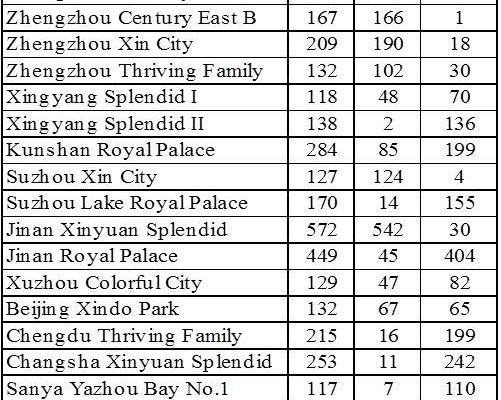
Consider first inventories. Table 1 indicates that “active†inventories were 2,036,000 square meters at the end of 2014. That is up from 1,047,000 square meters at the end of the third quarter.
Table 1. – Active Projects: Floor Area (m2 000), end 2014

Source:Â That data is now available
In addition, XIN has reported on planned projects (Table 2). Putting active and planned projects together, XIN has a healthy 3,080,000 square meter inventory going forward. One unexplained note: at the conference call, Yong Zhang, the Chairman of XIN talked of having launched 8 projects outside of China….
Table 2. – Xinyuan Planned Projects

Source:Â That data is now available
2. Prices, Sales and Projected Profits

