Following futures positions of non-commercials are as of September 17, 2024.10-year note: Currently net short 1,094k, up 71.9k.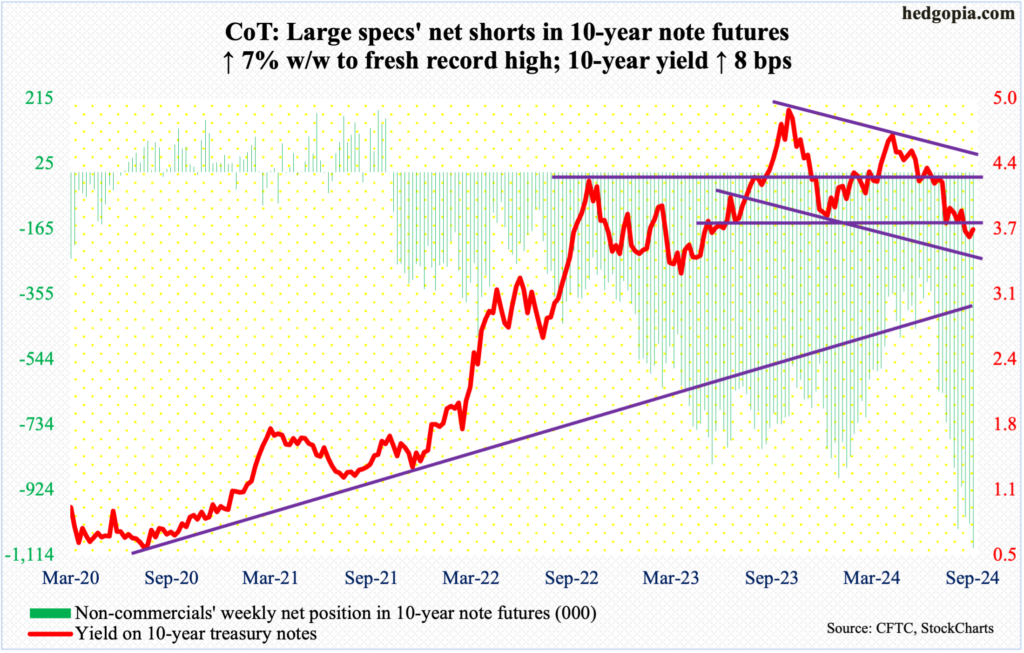 The fed funds rate was cut by 50 basis points to a range of 475 basis points to 500 basis points. Ahead of the two-day meeting ending on Wednesday, markets were just about split between a 25 and 50. Jerome Powell, Federal Reserve chair, described the jumbo cut as a recalibration to account for the sharp decline in inflation since reaching four-decade highs in 2022. Arguably, this can also be viewed as a way of them admitting they are behind the curve and hence the urgency.This was the first reduction in the benchmark rates since August 2019, when the FOMC began cutting from a range of 225 basis points to 250 basis points; by March 2020, rates were zero-bound, lasting two years. The current easing cycle is from north of five percent and is comparable to September 2007, when the fed funds rate was reduced from north of five percent and ended up zero-bound by December 2008, lasting seven years. We will find out over the course of time how and when this easing cycle resolves.For now, markets have smelled blood. They want more. There are two meetings left this year – November (6-7) and December (17-18) – and futures traders have priced in 75 basis points of cuts, meaning they expect one more 50, for a total of 125 basis points this year. In 2025, they expect cuts of the same magnitude, ending the year between 275 basis points and 300 basis points. The dot plot, on the other hand, expect cuts of 50 more basis points this year and another 100 basis points next year, ending 2025 in a range of 325 basis points and 350 basis points.To be fair, there is not a whole lot of difference between what the FOMC is willing to give and what the futures traders have priced in. But what is almost certain to happen is that if the Fed ends up cutting by 75 basis points in November and December this year, odds strongly favor the futures traders would immediately price in more than 125 basis points next year.The Fed may just have fallen into a trap of enthusiastically acquiescing to the markets’ demands, which the latter itself was not 100 percent sure it would get. A hawkish surprise is out of the question for now.30-year bond: Currently net short 109.7k, up 45.5k.
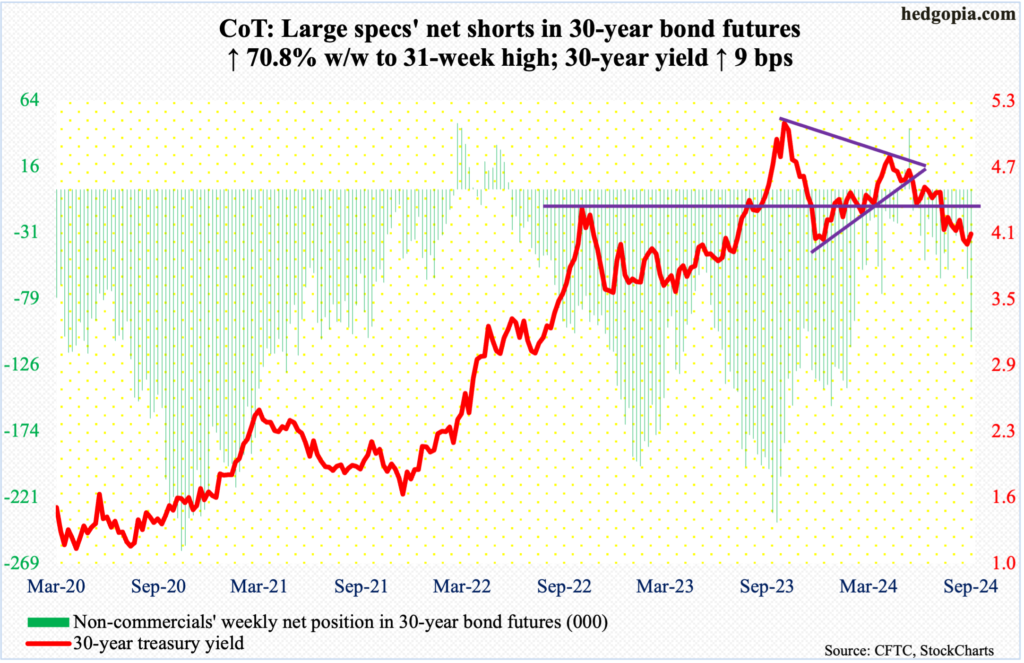 Major US economic releases for next week are as follows.The S&P Case-Shiller home price index (July) is on schedule for Tuesday. In June, home prices nationally appreciated 5.4 percent from a year ago. This was the fourth consecutive monthly decline since prices rose 6.6 percent in February.New home sales (August) will be reported Wednesday. July sales jumped 10.6 percent month-over-month to a seasonally adjusted annual rate of 739,000 contracts – a 14-month high.Thursday brings durable goods orders (August), GDP (2Q24, 2nd revision) and corporate profits (2Q24, revised).New orders for non-defense capital goods ex-aircraft – proxy for business capex plans – edged lower 0.1 percent m/m in July to $73.6 billion. A record high $74 billion was reached last December.The second print showed real GDP grew at an annual rate of three percent in the second quarter.In the June quarter, corporate profits adjusted for inventory valuation and capital consumption grew eight percent year-over-year to $3.42 trillion (SAAR), which set a record.Personal income (August) and the University of Michigan’s consumer sentiment index (September, final) are scheduled for Friday.In the 12 months to July, headline and core PCE (personal consumption expenditures) rose 2.5 percent and 2.6 percent respectively. In 2022, they were growing at four-decade highs of 7.1 percent (June) and 5.6 percent (February), in that order.September’s preliminary estimate showed consumer sentiment increased 1.1 points m/m to 69 – a four-month high. March’s 79.4 was the highest since July 2021.WTI crude oil: Currently net long 142.3k, up 22.4k.
 Last week, after four consecutive down weeks – and eight in nine – West Texas Intermediate crude formed a weekly spinning top rallying 1.45 percent. This week, it added another 3.4 percent to $71/barrel.Sentiment has been suppressed for a while now, with non-commercials having cut net longs to a 14-year low as of last Tuesday. They added some in the latest week.There is a well-established range between $71-72 and $81-$82. Horizontal support at $71-$72 goes back nearly two decades. Oil bears were already getting active at the broken support, with Thursday ticking $71.53 and Friday $71.45. Once this hurdle gives way – probable – bulls will be eyeing the top of the range, which now also coincides with a falling trendline from last September when the crude peaked at $95.03. WTI subsequently bottomed at $65.27 on the 10th this month, leaving the May 2023 low of $63.57 intact.In the meantime, US crude production in the week to September 13th declined 100,000 barrels per day week-over-week to 13.2 million b/d. In August, weekly output hit a record 13.4 mb/d twice. Crude imports decreased 545,000 b/d to 6.3 mb/d. As did crude inventory which dropped 1.6 million barrels to 417.5 million barrels. Stocks of gasoline and distillates, however, increased – up respectively 69,000 barrels and 125,000 barrels to 221.6 million barrels and 125.1 million barrels. Refinery utilization declined seven-tenths of a percentage point to 92.1 percent.E-mini S&P 500: Currently net short 122.9k, up 63.6k.
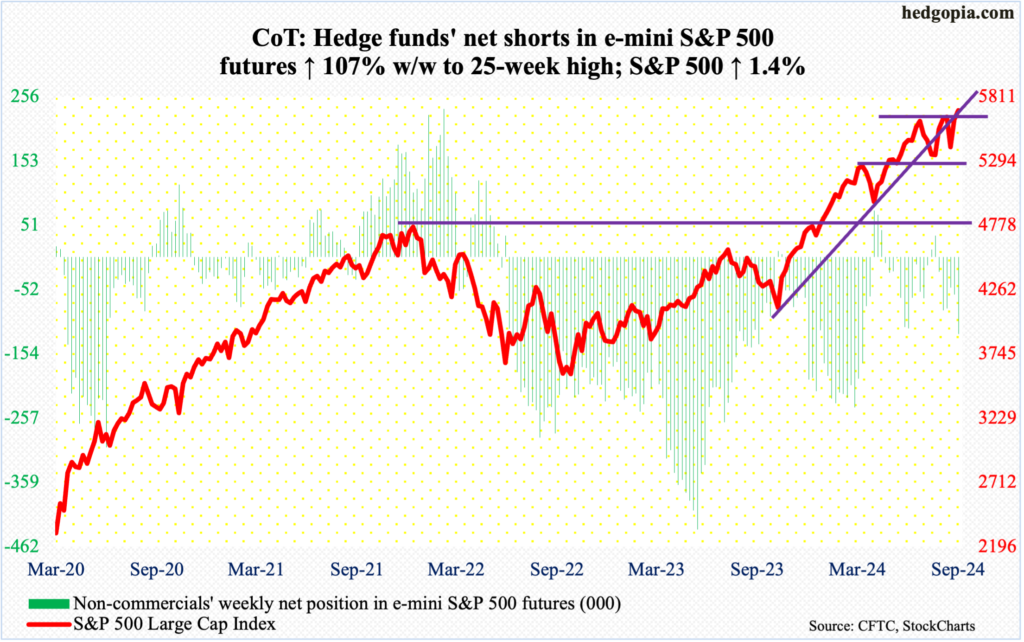 Having closed last week just under horizontal resistance at 5640s-50s, equity bulls did manage to break out this week, but they had to wait until Thursday ().This week, the S&P 500 failed to hang on to Tuesday’s intraday breakout, as sellers appeared at the July 16th high – 5670 back then versus 5671 now. Wednesday, the large cap index rallied as high as 5690, but only to reverse hard to end the session at 5618. This was then followed by Thursday’s breakout, ticking 5734 intraday and closing at 5714. Come Friday, intraday weakness was bought at 5674 to close the session at 5703, up 1.4 percent for the week.The week clearly belonged to the bulls, although the last three candles – Wednesday’s shooting star, Thursday’s spinning top and Friday’s hanging man – demand caution despite the breakout. Friday, in fact, witnessed a successful breakout retest, but conviction was lacking. The daily RSI ended the week just under 63; in contrast, on its way to the July peak in the S&P 500, the momentum indicator persisted over 70 – even low-80s at one time – for a month before going back under 70.Euro: Currently net long 69.6k, down 11.8k.
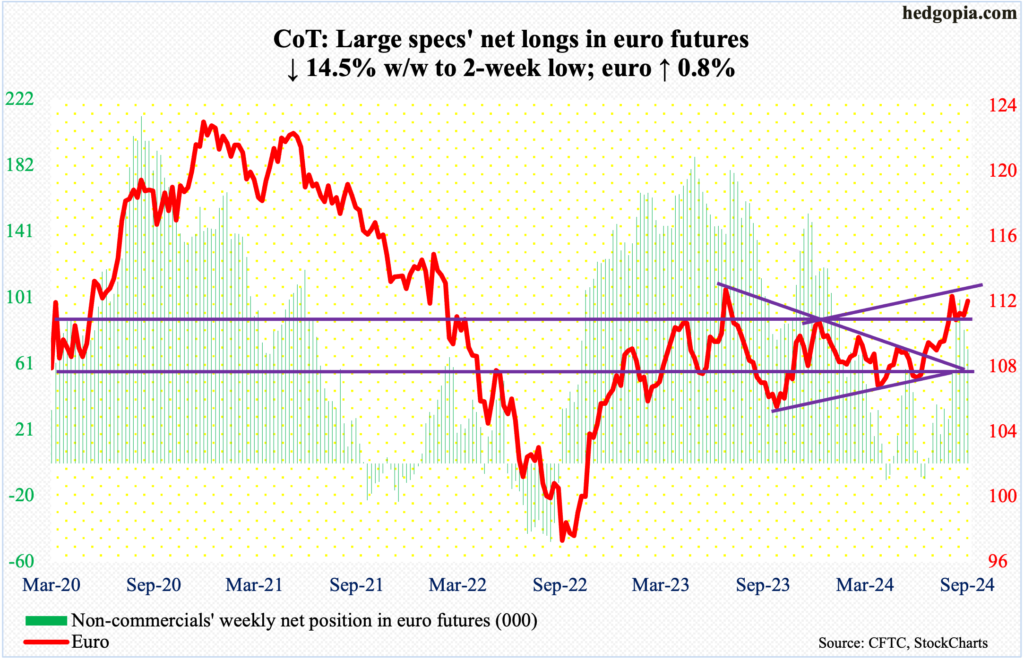 The euro dropped from $1.128 in July last year to $1.045 in October. From that low, it made several higher lows before recapturing $1.10 five weeks ago, although trading since has been tentative. For two weeks, rally attempts stopped at $1.12. Again this week, the currency went after that level with Wednesday reaching $1.1189 and ending the week at $1.1164, up 0.8 percent for the week.It feels like euro bulls will sooner or later manage to take out $1.12, but even if that happens, there is channel resistance just above.Gold: Currently net long 310.1k, up 27.6k.
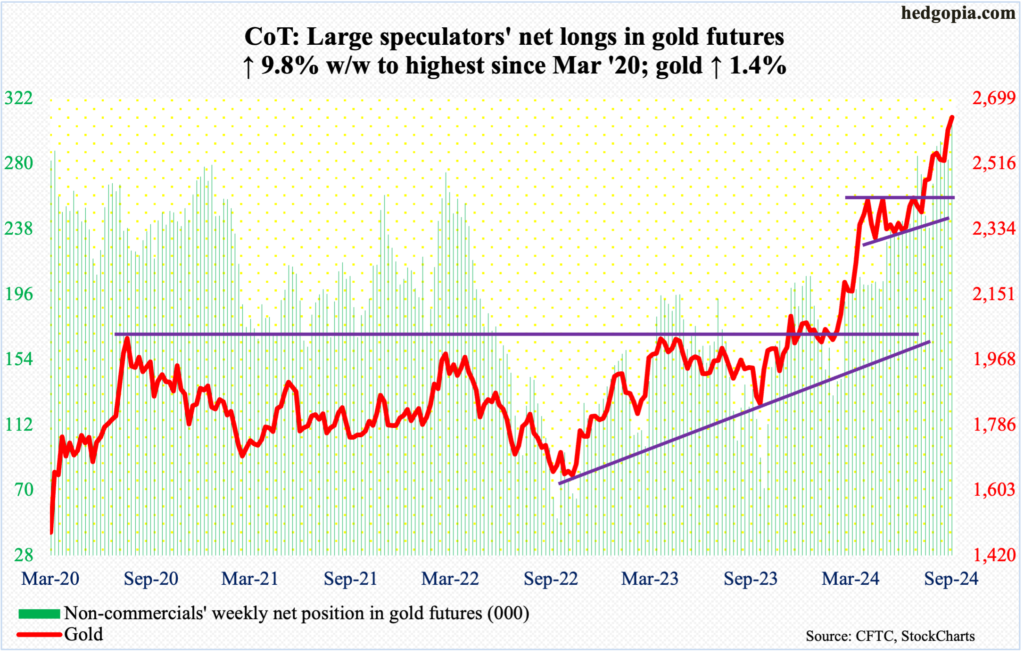 Yet another week and yet another high! After five sessions of sideways action at $2,510s, gold broke out Friday touching $2,651 intraday and closing at $2,646/ounce. For the week, it rose 1.4 percent.This week’s action followed last week’s breakout at $2,540s-50s after several unsuccessful attempts since mid-August. The metal has experienced a sustained rally from $2,305 this June, including an August breakout at $2,440s-50s after more than three months of sideways action.Non-commercials, with net longs the highest since March 2020, are positioned for continuation of the current momentum.Nasdaq (mini): Currently net long 19.2k, down 6.4k.
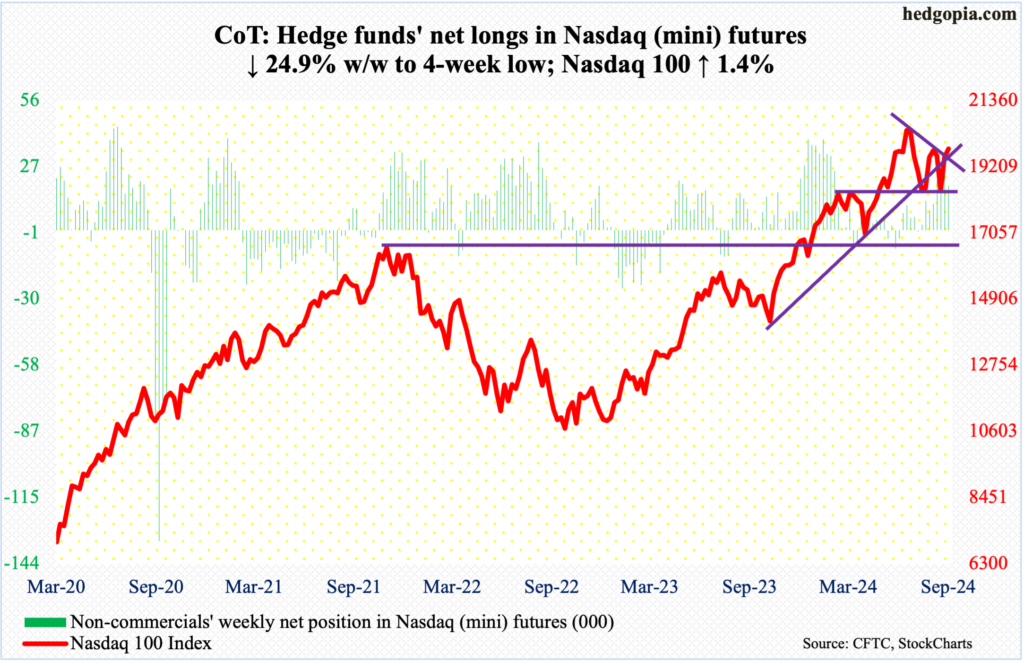 Unlike the S&P 500, the tech-heavy Nasdaq 100 is yet to surpass its high from July, when it peaked at 20691 on the 10th. This week, it rallied a rather subdued 1.4 percent to 19791.That said, tech bulls did manage to push the index past dual resistance – one a falling trendline from the July high and the other broken rising trendline from last October’s low. This is positive, but it remains to be seen if the bulls will succeed in getting a lot of mileage out of this.Thursday’s intraday high of 19952 is worth a watch.Russell 2000 mini-index: Currently net long 3k, down 2.7k.
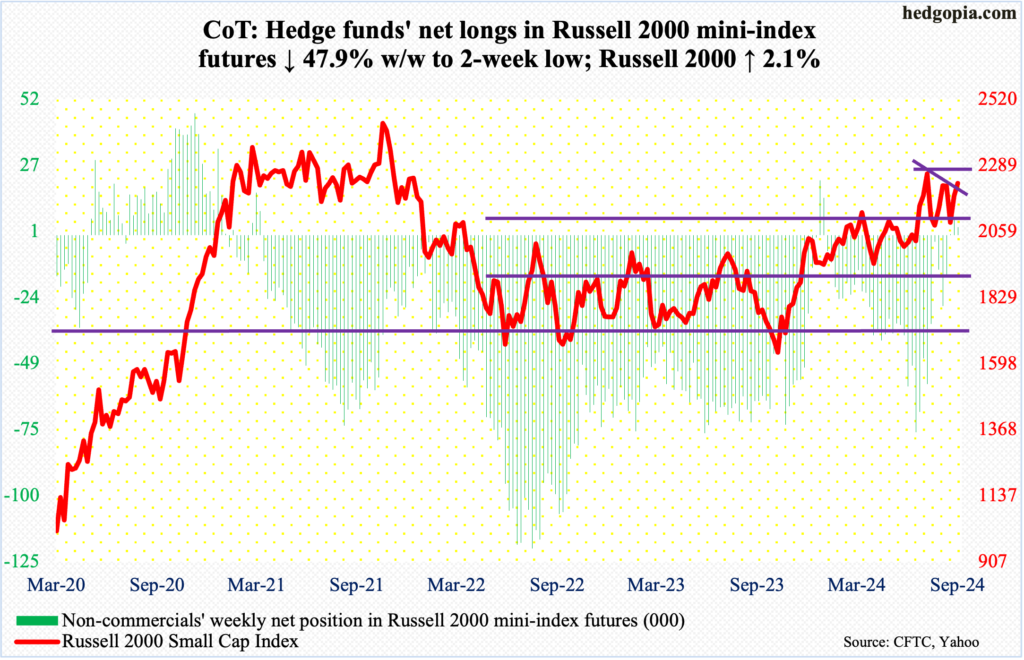 The Russell 2000 broke out of a month-and-a-half symmetrical triangle, then faced resistance just under 2260s.The small cap index reversed hard on July 31 after ticking 2300 intraday and quickly dropped to 1993 by August 5. A symmetrical triangle can be drawn using these two price points. Last week, the Russell 2000 sat just under the falling trendline. This week, it broke out on Monday and proceeded to print 2259 on both Wednesday and Thursday, followed by a Friday close of 2228, which remains substantially below the all-time high of 2459 from November 2021.Horizontal resistance at 2260s goes back to mid-July. This week’s breakout is a step in the right direction, but until 2260s are taken care of, small-cap bulls will find it hard to build on the recent momentum.US Dollar Index: Currently net long 1.8k, down 18.4k.
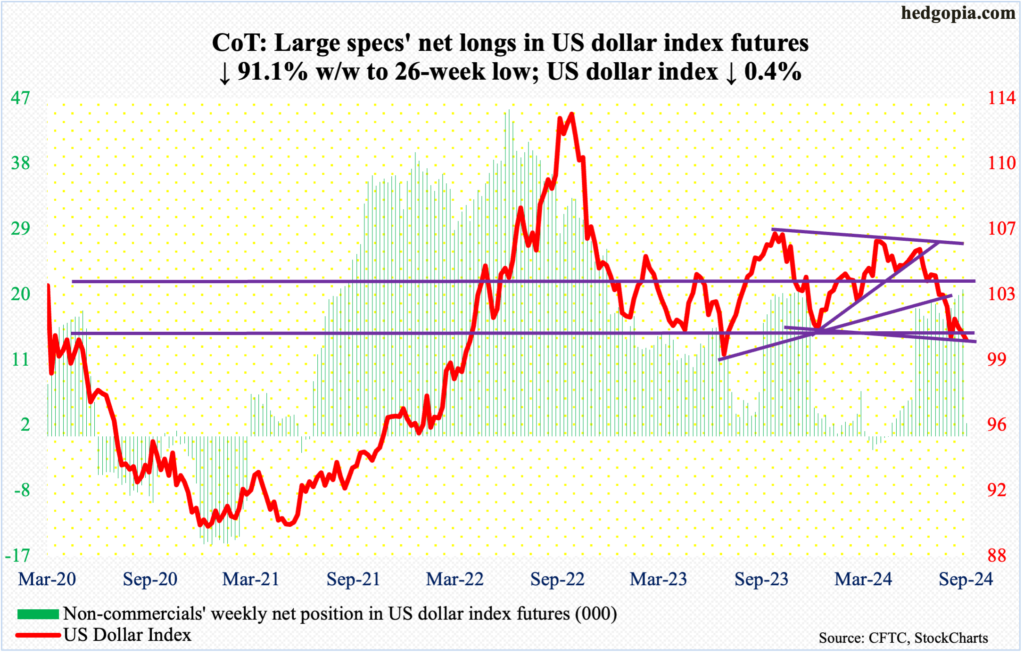 Wednesday, the US dollar index ticked 99.89 intraday to briefly breach crucial horizontal support at 100-101, which goes back years, but managed to crawl its way back above, closing the session at 100.28. By the end of the week, it dropped 0.4 percent to 100.42 – not a whole lot above Wednesday’s low. So, the risk of a breach of 100-101 remains. Should that happen, the question is if it will be a decisive breach or something along the lines of July last year when the index bottomed at 99.22 and reversed sharply higher, eventually peaking at 107.05 in October.In the event of a rally right here, the level to watch is 103-104, which goes back to December 2016. The support was lost early last month.VIX: Currently net short 6.5k, down 8.6k.
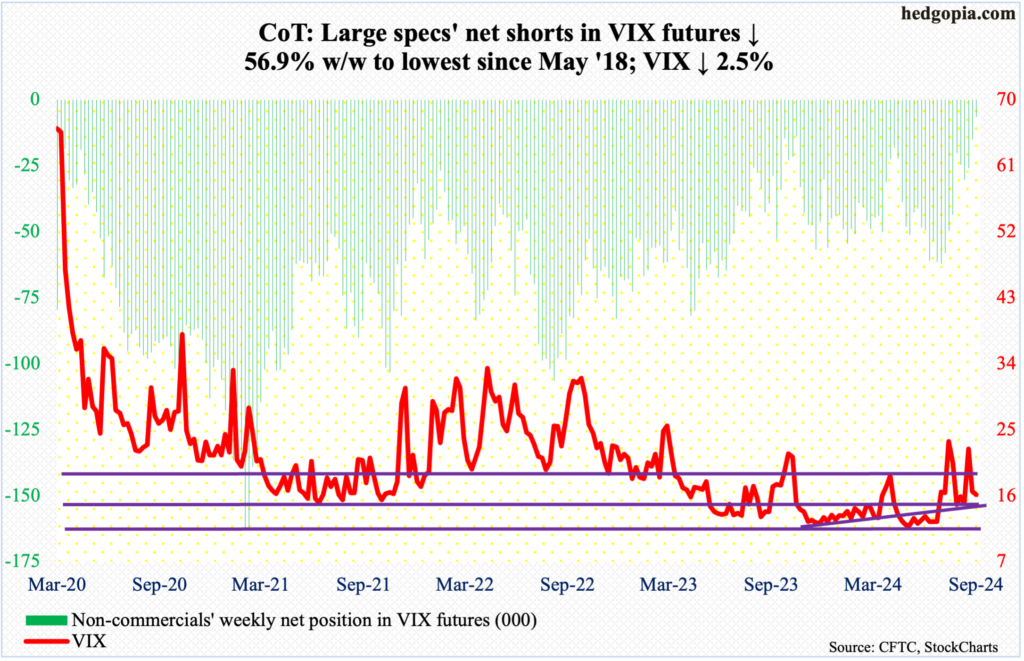 VIX acts like it wants lower prints in the sessions ahead. This week, it shed 0.41 points to 16.15, which arguably is elevated considering a new high in the S&P 500.Importantly, on the weekly, the RSI closed right on the median, which the metric has not breached the last two and a half months. Concurrently, on the daily, the volatility index rests between the 50- and 200-day moving averages (18.07 and 14.76 respectively); VIX has not breached the latter for two months now, and it will be an interesting development – unlikely – should that happen.Thanks for reading!More By This Author:
What The Latest CoT Report Tells Us About Who’s Buying What

