Courtesy of Lee Adler of the Wall Street Examiner
Yesterday the media got all bulled up over the Fed’s new data on household wealth showing that it hit a record in the fourth quarter of 2013. As usual with Wall Street’s chattering media class, this wasn’t quite the whole story, at least not the “real†story.Â
The total net worth of households and non profits did reach a record in nominal terms. But that’s not the same thing as the wealth of individual households hitting a record in real, inflation-adjusted terms. In addition, the calculation of the numbers is based on absurd assumptions which everyone takes for granted as being realistic. And if the net worth of the top 1% was lopped off, the picture would be far bleaker.
But we need not even go there. By now it’s been well established that those in the upper income strata have gotten virtually all of the gains in wealth in recent years while the majority falls deeper into the economic mire.
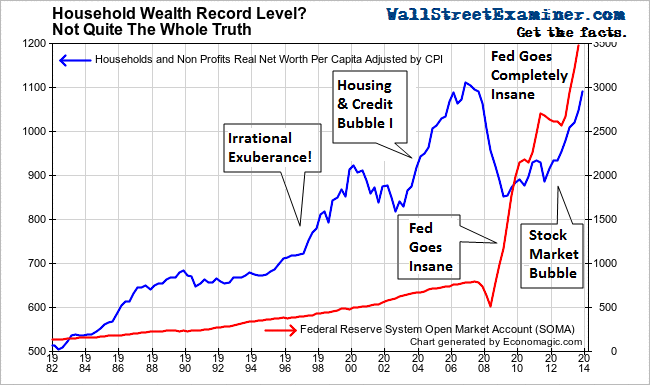
For this analysis I just look at the data as a whole, and do the simple exercises of dividing the total net worth of households and non-profits of $80.66 trillion by the census bureau’s estimate of the total year end population of the US of 317.44 million. Then I converted that to real terms by dividing the result by the Consumer Price Index. That’s conservative enough. It probably understates inflation by underweighting housing and doesn’t take into account asset inflation at all. But it’s a widely accepted means of converting nominal measures into real, inflation adjusted numbers. The same operation is then performed for every quarter going back in time as far as the data goes. The results are then plotted on this graph. It shows how the wealth of households has trended in real terms per capita.
Â

Real Household Net Worth Per Capita – Click to enlarge
Â
I’ve also plotted alongside that line a graph of the Fed’s holdings in its System Open Market Account, which is all of the Fed’s paper holdings that it acquires in trades with Primary Dealers. Prior to 2007, the Fed had steadily grown its holdings at the rate of about 4-5% per year. Household wealth grew at almost double that rate beginning in 1994, prompting Alan Greenspan to proclaim “irrational exuberance†in 1996. Greenspan was particularly concerned that the prices of stocks were growing faster than the Fed’s balance sheet. That was something new. Historically they had grown at more or less the same rate.

