Something strange is taking place in China, and we are not talking about the largely optical, mostly irrelevant first downgrade of China by Moody’s since 1989 (which still managed to unleash diplomatic hell in Beijing), and in which the rating agency simply admitted what everyone else already knew about the 300% debt/GDP economy.
The bigger issue, as we noted previously, is that both the short-term…
Â

and conventional Chinese funding market appears to be breaking…

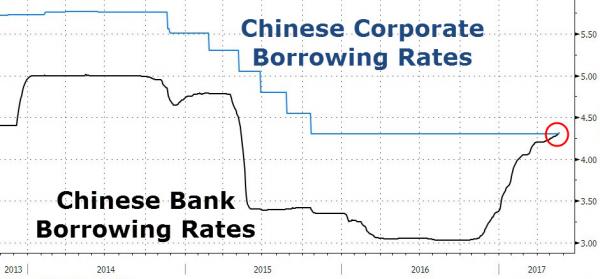
… because as of this week, not only has the one-year Shanghai Interbank Offered Rate, or SHIBOR, exceeded the Loan Prime Rate for the first time ever, meaning Chinese banks’ cost of borrowing is now above the rate they charge customers, but the Chinese government bond yield curve has inverted in not just one, but two places, with both the 3s5s and the 7s10s negative.

The question everyone wants answered is why. One attempt at just that, came today from UBS which first give the blow by blow of how we got there:
As market concerns about financial regulation continued in the first half of May, bond yields kept rising, with the 10-year CGB yield reaching 3.69% on 10 May. The People’s Bank of China (PBoC) renewed MLFs and increased net liquidity injection through OMOs. April economic data, such as FAI released by NBS, came in weaker than market expectations. More importantly, there were media reports that the China Banking Regulatory Commission (CBRC) showed a soft tone in requirements for banks to reach standards. Besides, the central bank’s statement on strengthening coordination in financial regulations eased market concerns about financial regulation.
As a result of these factors, the back end of the yield curve declined while the front end to continued rising moderately. According to Chinabond yield curves, as of 19 May 2017, 1-year, 5-year and 10-year CGB yields were 3.48%, 3.68% and 3.63%, respectively, up 9bp, 20bp and 7bp compared with 5 May 2017. Yields of 1-year, 5-year and 10-year policy financial bonds (CFBs; we use the bonds issued by the Export and Import Bank of China as examples) were 4.11%, 4.45% and 4.51%, respectively, up 21bp, 10bp and 6bp compared with 5 May 2017.

