After the worst start in history for U.S. stocks everyone will be searching for meaning. One strategy has worked for almost seven years, but what about now?
Is it time to “buy the dip?â€
Prior Theme Recap
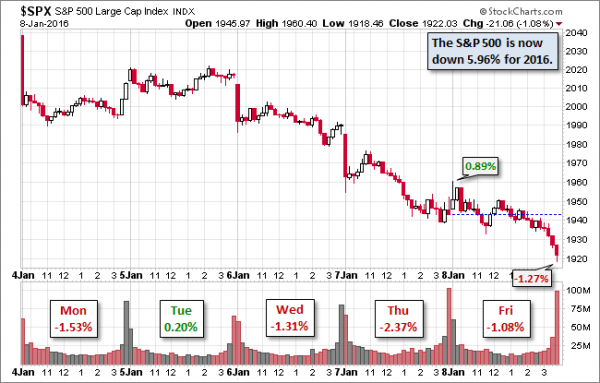
In my last WTWA I predicted that the start of a new year would focus attention on one of the several different “January effects.†This proved to be a secondary consideration. Instead, news from China rippled around the world, pressuring U.S. trading before Monday’s opening. The China story continued through Thursday. Even a strong employment report on Friday could not reverse the selling pressure. There are some still debating the seasonal effects, but it was a minor theme last week. You can see the sad story for stocks from Doug Short’s weekly chart. (With the ever-increasing effects from foreign markets, you should also add Doug’s weekly chart to your reading list).

Â
Doug’s update also provides multi-year context. See his weekly chart for more excellent charts and analysis.
We would all like to know the direction of the market in advance. Good luck with that! Second best is planning what to look for and how to react. That is the purpose of considering possible themes for the week ahead. You can make your own predictions in the comments.
This Week’s Theme
There are plenty of important data releases this week, but I expect a focus on interpreting last week’s selling. Since the market bottom in 2009, it has been a winning strategy to buy every “dip.†The problem is that dips cannot be identified until they are over! Expect a spirited debate next week, with observers asking –
Is it once again time to “buy the dip?â€
Here is a preview of what to expect.
| Topic | More Downside | Just a Dip |
| Valuation | Time for the bearish indicators (CAPE, Tobin’s Q) to have their day. | Markets reasonable or even attractive on dividend yield and comparison to alternatives. |
| Seasonality | First few trading days predict the entire year. | Last week’s five days were no different from any five days. |
| China | 2nd largest economy can drag the world down. | Chinese stock market has little to do with investments in other countries. |
| Dollar | Strong dollar cripples U.S. exports and earnings. | Dollar strength might not continue, and also has positive effects. |
| Oil prices | Might reach $20 per barrel. | Might rebound to $70 per barrel. |
| Recession | Â Imminent and unavoidable | Â Not shown by best measures |
| Earnings | Stagnating and might be lower for a full year comparison. | Growth reasonable outside of the energy sector. |
| The Fed | No more Greenspan/Bernanke/Yellen “put.†| Market strength based on improvement in the economy and earnings. |
| Volatility | Higher volatility shows greater fear and a negative outlook. | People underestimate “normal†volatility. The VIX index is a concurrent (not leading) indicator. |
As always, I have my own opinion in the conclusion. But first, let us do our regular update of the last week’s news and data. Readers, especially those new to this series, will benefit from reading the background information.
Last Week’s Data
Each week I break down events into good and bad. Often there is “ugly†and on rare occasion something really good. My working definition of “good†has two components:
- The news is market-friendly. Our personal policy preferences are not relevant for this test. And especially – no politics.
- It is better than expectations.
The Good
Despite the negative result for stocks, there was plenty of good news last week.
- ISM non-manufacturing remained strong at a level of 55.3, a touch below expectations.
- Bullish sentiment makes a new low. Bespoke has the story and this chart:

Initial jobless claims continued to decline with the four-week moving average under 276K. Calculated Risk has the story.

Â
- Private job growth was strong – a gain of 257K according to the ADP report.
-
The employment report was very strong.
- The WSJ has an excellent summary of the numbers.
- The quality of new jobs has also improved. (Philly Fed report via GEI).
- James Picerno’s analysis emphasizes the long view, including this chart.
Â

Â
The Bad
Some of the economic data was disappointing.
- ISM manufacturing was in contraction territory (48.2) and also missed expectations.
- Auto sales fell to a seasonally adjusted annual rate of 17.34 million, the lowest rate since June. On the bright side, truck sales were up 8% on a year-over-year basis.
- Construction spending fell by 0.4% when a 0.7% gain was expected.
- Factory orders missed expectations with a small m-o-m loss.
- Wholesale sales disappointed. Steven Hansen of GEI describes inventories as at “levels associated with recessions.â€
The Ugly
North Korea. A hydrogen bomb in the hands of a country that views radio broadcasts as an act of war is dangerous. The NYT has a good account of the bomb story and The Guardian covers the radio news.
