Once again, the expected quiet summer week was instead filled with action. With analysts of all stripes analyzing every aspect of the changes in the Trump Administration, the financial punditry will do the same. Ignoring the politics and personalities, we are still left with a question that is important to investors:
Is a Market-Friendly Policy Agenda Now in Peril?
Last Week Recap
My notion that last week would be all about Korea and a possible correction was only half right. The Charlottesville events, the aftermath, and the President’s reactions took center stage. The turmoil once again offered a reason to sell. Once again this occurred despite a good week for economic data.
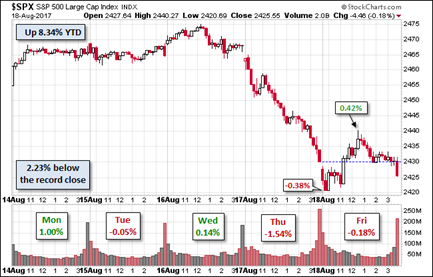
The Story in One Chart
I always start my personal review of the week by looking at this great chart from Doug Short via Jill Mislinski.

Doug has a special knack for pulling together all the relevant information. His charts save more than a thousand words! Read the entire post for several more charts providing long-term perspective, including the size and frequency of drawdowns.
The Silver Bullet
As I indicated recently I am moving the Silver Bullet award to a standalone feature, rather than an item in WTWA. I hope that readers and past winners, listed here, will help me in giving special recognition to those who help to keep data honest. As always, nominations are welcome!
The News
Each week I break down events into good and bad. For our purposes, “good†has two components. The news must be market friendly and better than expectations. I avoid using my personal preferences in evaluating news – and you should, too!
The economic news last week was generally positive.Â
The Good
- North Korea backed off from a threatened missile launch toward Guam. There were some signs that diplomacy might prevail over military escalation.
- Retail sales increased 0.5%, handily beating expectations of 0.3%. New Deal Democrat notes both the strength and upward revisions to prior numbers. Steven Hansen (GEI) confirms the interpretation with his year-over-year, rolling average approach. E-commerce sales continued to lead, growing 16.2% year-over-year. Horan Capital Advisors has more detail, including this chart.

- LA port traffic is the busiest ever. (Calculated Risk).
- Michigan sentiment jumped to 97.6. Doug Short’s great chart shows how this compares with past highs and with GDP.

- NAHB housing market index moved much higher (68 v last month’s 64) and handily beat expectations of 65.
- Leading indicators, jobless claims and industrial production matched the positive expectations.
The Bad
- Rail traffic remains in contraction when analyzed without coal and grain. Steven Hansen (GEI).
- Building permits and housing starts both declined and missed expectations. Calculated Risk notes that multi-family is volatile, mostly moving sideways, but down 35% year-over-year. Single-family starts are up 10.9% year-over-year.

The Ugly
The cholera outbreak in Yemen has now spread to 500,000 people in the last four months. Stat provides perspective and describes the struggle to fight this disease. 30,000 health care workers have not been paid in more than a year.
Noteworthy
Better Congressional procedures would encourage more efficient attention to legislation. The Bipartisan Policy Center does a six-month review of the 115th Congress. Questions like number of days worked, use of committees, and delays are part of this analysis.
The Week Ahead
We would all like to know the direction of the market in advance. Good luck with that. Second best is planning what to look for and how to react.
The Calendar
