It is a big week for economic data. The punditry will be analyzing the Trump tax proposal. Everyone will be drawing conclusions about how these factors may be linked with stock prices. Expect people to be asking:
Does economic strength equal stock market strength?
Last Week Recap
My expectation for last week was right on target. Attention rapidly turned to the Trump tax proposal. More on that in today’s Final Thoughts.
The Story in One Chart
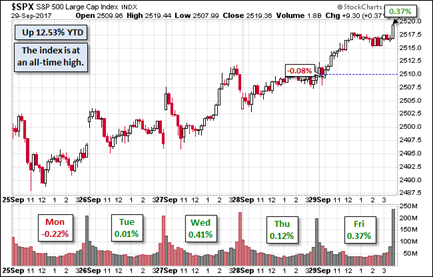
I always start my personal review of the week by looking at this great chart from Doug Short via Jill Mislinski. She notes the weekly gain of 0.68%. While the range was slightly higher than last week, it was still less than 1.5% on an intra-day basis.

Doug has a special knack for pulling together all the relevant information. His charts save more than a thousand words! Read the entire post for several more charts providing long-term perspective, including the size and frequency of drawdowns.
The Silver Bullet
As I indicated recently I am moving the Silver Bullet award to a standalone feature, rather than an item in WTWA. I hope that readers and past winners, listed here, will help me in giving special recognition to those who help to keep data honest. As always, nominations are welcome!
The News
Each week I break down events into good and bad. For our purposes, “good†has two components. The news must be market friendly and better than expectations. I avoid using my personal preferences in evaluating news – and you should, too!
The economic news remained quite positive.
The Good
- Q2 GDP registered a revised gain of 3.1%. This is backward looking, but an improved base for the rest of the year. The third quarter does not look as promising. Jill Mislinski’s “inside the GDP†story is a great look at the impact of individual GDP components.

- North Korea and the USÂ are in direct contact (BBC). The back-channel discussions will probably be more fruitful than the contact via tweets.
- Serious mortgage delinquencies declined again. Fannie Mae (via Calculated Risk) notes that the level is at its lowest since November, 2007.
- Jobless claims “defy natureâ€Â reports Bespoke. Their well-designed chart illustrates the point. New Deal Democrat’s “weather adjusted†calculation puts initial claims at 237K.

- New home prices have moved higher because builders’ need to compete with distressed sales has declined. (Calculated Risk).

- Durable goods beat expectations overall, but not in the “core.†This series is challenging to interpret, with volatile changes in aircraft and military spending.
- Bullish sentiment declined markedly. Bespoke notes the largest weekly decline since May, to 33.3%. It has been below 50% for 143 weeks. For those who believe in this as a contrary indicator, it is quite bullish. It also calls into question the frequently-heard claim that investors are “complacent.â€

- Bespoke notes the largest weekly decline since May, to 33.3%. It has been below 50% for 143 weeks. For those who believe in this as a contrary indicator, it is quite bullish. It also calls into question the frequently-heard claim that investors are “complacent.â€GEI)
- Chicago PMIÂ of 65.2 handily beat the prior reading of 58.9 and expectations of 58. We shall see if this is a solid precursor to the national report.
- Aid to Puerto Rico — excellent, appreciated, and effective. (NY Post and President Trump but see below).
The Bad
- Aid to Puerto Rico – delayed and inadequate, adding to a “humanitarian crisisâ€. House Speaker Paul Ryan, but see above).
- Pending home sales decreased 2.6%, significantly missing expectations of a 0.5% decline. Calculated Risk discusses, including the hurricane effects.
- Rail traffic remains weak via Steven Hansen’s (GEI) focused approach on the important components. He also notes the Harvey and Irma effects.
- Consumer confidence declined slightly, missing expectations. Both the Conference Board and Michigan measures remain at very high historical levels. Jill Mislinski’s Doug Short chart (GEI) pulls all of the information together in a single look. Read the entire post for more charts, including the Michigan version.
