After last week’s avalanche of economic data, the calendar is back to normal. More important is the onset of earnings season. Recent data have reassured many observers about the health of the U.S. economy. The period of seasonal weakness is ending. Expect people to be asking:
Can this earnings season lead to a big year-end rally?
Last Week Recap
My expectation for last week concerned the relationship between economic and stock market strength. That discussion might come another day, but last week’s attention was focused on Las Vegas.
The Story in One Chart
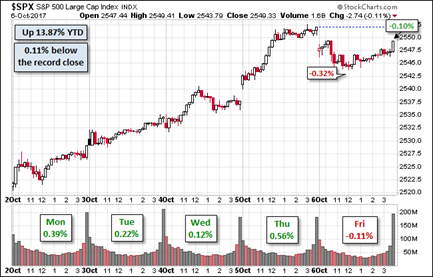
I always start my personal review of the week by looking at this great chart from Doug Short via Jill Mislinski. She notes the gain of 1.18% on the week, as well as other key comparisons. Once again, it was a week of very low volatility.

Doug has a special knack for pulling together all the relevant information. His charts save more than a thousand words! Read the entire post for several more charts providing long-term perspective, including the size and frequency of drawdowns.
Personal Note
Next week I am off for a weekend jaunt to celebrate Mrs. OldProf’s birthday. I’ll try to post an indicator update, and maybe a bit more.
The News
Each week I break down events into good and bad. For our purposes, “good†has two components. The news must be market friendly and better than expectations. I avoid using my personal preferences in evaluating news – and you should, too.
The economic news remained quite positive. New Deal Democrat’s weekly update of high frequency indicators shows what is going on in various lead times. “The last few months have been boringly consistent, but in a good way.â€Â
The Good
- Auto sales notched a gain of 14.8% over last month with an annual rate of 18.4 million in September. Hurricane replacements helped the increase. (Calculated Risk). See also “Davidson†via Todd Sullivan.

- Factory orders rebounded from last month’s decline of 3.3% to a gain of 1.2%, beating expectations.
- Construction spending also bounced from a decline of 1.2% to a gain of 0.5%, beating expectations.
- ISM manufacturing index reached 60.8, over 60 for the first time in thirteen years. Bespoke cites key elements of the report to show both the overall strength and the hurricane effects.

- ISM services also registered a huge beat. (Bespoke).

The Bad
- Rail traffic is showing some improvement, but remains in contraction if one removes call and grain. By contrast, the intermodal measure showed strength. The data are difficult to interpret. Steven Hansen (GEI) is much more thorough than you will find in other sources.

-
Employment news was bad, at least in terms of the headline numbers. Hurricane effects are important to consider and defy accurate adjustments. I will include each of the key points in this section, positive, negative, and adjustments.
- ADP private employment grew only 135K, down from last month’s 228K and missing expectations for 160K.
- Initial jobless claims continue lower, now at 260K. While not at the levels from earlier in 2017, the hurricane effects clearly impacted this series.
- Headline payroll jobs declined by 33K and prior months were revised a bit lower. Unemployment declined to 4.2% and job gains from the household survey were 906K
- Hourly wages improved, but the change might well result from the compositional effects of the weather – a greater effect on lower-paid workers. (Dean Baker). His analysis wisely concludes that this report needs some context from the October data.
-
Labor force participation is improving
(WSJ)
