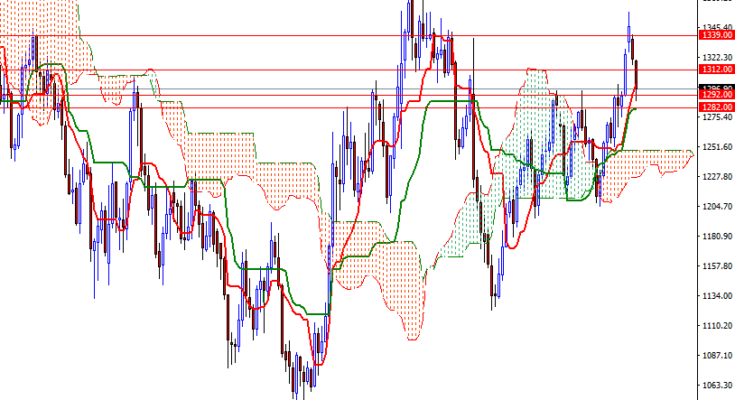
Gold prices settled at $1296.90 an ounce, falling nearly 1.7% over the course of the week, as a stronger dollar and climbing stocks dampened demand for gold. The FOMC meeting was more hawkish than what the market was anticipating. The Fed announced that it will start reducing its big balance sheet of U.S. securities next month and left open the possibility of raising short-term interest rates by the end of the year. The latest data from the Commodity Futures Trading Commission (CFTC) showed that speculative traders on the Chicago Mercantile Exchange reduced their net-long positions in gold to 236089 contracts, from 254760 a week earlier.
Although the central bank signaled a December rate hike is still on the table, the outlook for 2018 remains largely unchanged in the latest projections. Geopolitical tensions in the Middle East as well as heating rhetoric between Pyongyang and U.S. President Donald Trump are other factors to watch out. Technical selling was also behind gold’s decline on last week. XAU/USD was unable to hold above 1318 and ultimately the market ended up testing the support around the 1292 level.

The short-term charts are still bearish, with the market trading below the Ichimoku clouds on the H4 and the H1 time frames, and the bears don’t appear to be exhausted after recent selling pressure. The weekly and the daily charts, on the other hand, remain bullish. If the bulls can penetrate the 1302-1298 area occupied by the hourly Ichimoku cloud, they may have a change to challenge 1308 and perhaps 1315/2. A daily close beyond 1315 implies that the market is on its way to 1320. The bulls have to eliminate this strategic barrier in order to take the reins and make a move towards 1326. To the downside, keep an eye on the 1292/88 zone. Breaking below 1288 would indicate that the 1282/0 area (the 50% retracement of the bullish run from 1204.76 to 1357.47) might be the next port of call. If the bears capture this camp, prices will probably retreat to the 1275 area, where the top of the daily cloud sits.

