Goldman Sachs (GS)
The Goldman Sachs Group, Inc. is global investment banking, securities and investment management firm that provides a wide range of financial services to a substantial and diversified client base that includes corporations, financial institutions, governments and high-net-worth individuals.
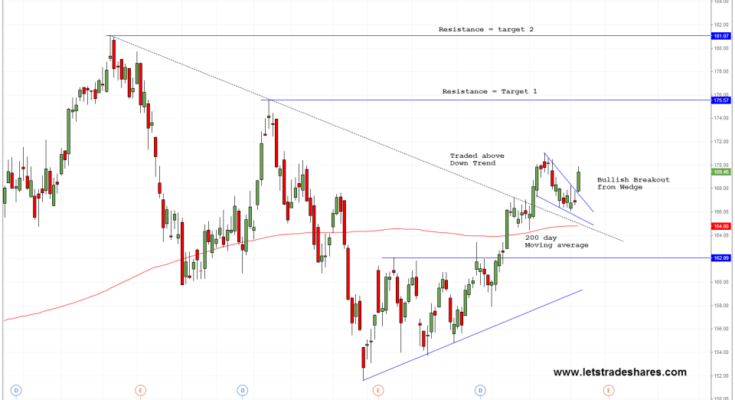
The chart below shows it’s share price over the past seven months. The downtrend was broken in mid June with prices consolidating above the 200 day moving average. Over the past fortnight the price has retraced to form a bullish wedge. Yesterday saw a bullish candle breakout from the wedge pattern. This is my signal to enter a long position trade.
On this setup I will look to go long at a price of $168.00 with a stop-loss under the wedge low of $166.00. My initial target will be the resistance high from March of $175.00.
Happy Trading
Flavio

DAILY CHART GOLDMAN SACHS (GS)
Â

