
(Click on image to enlarge)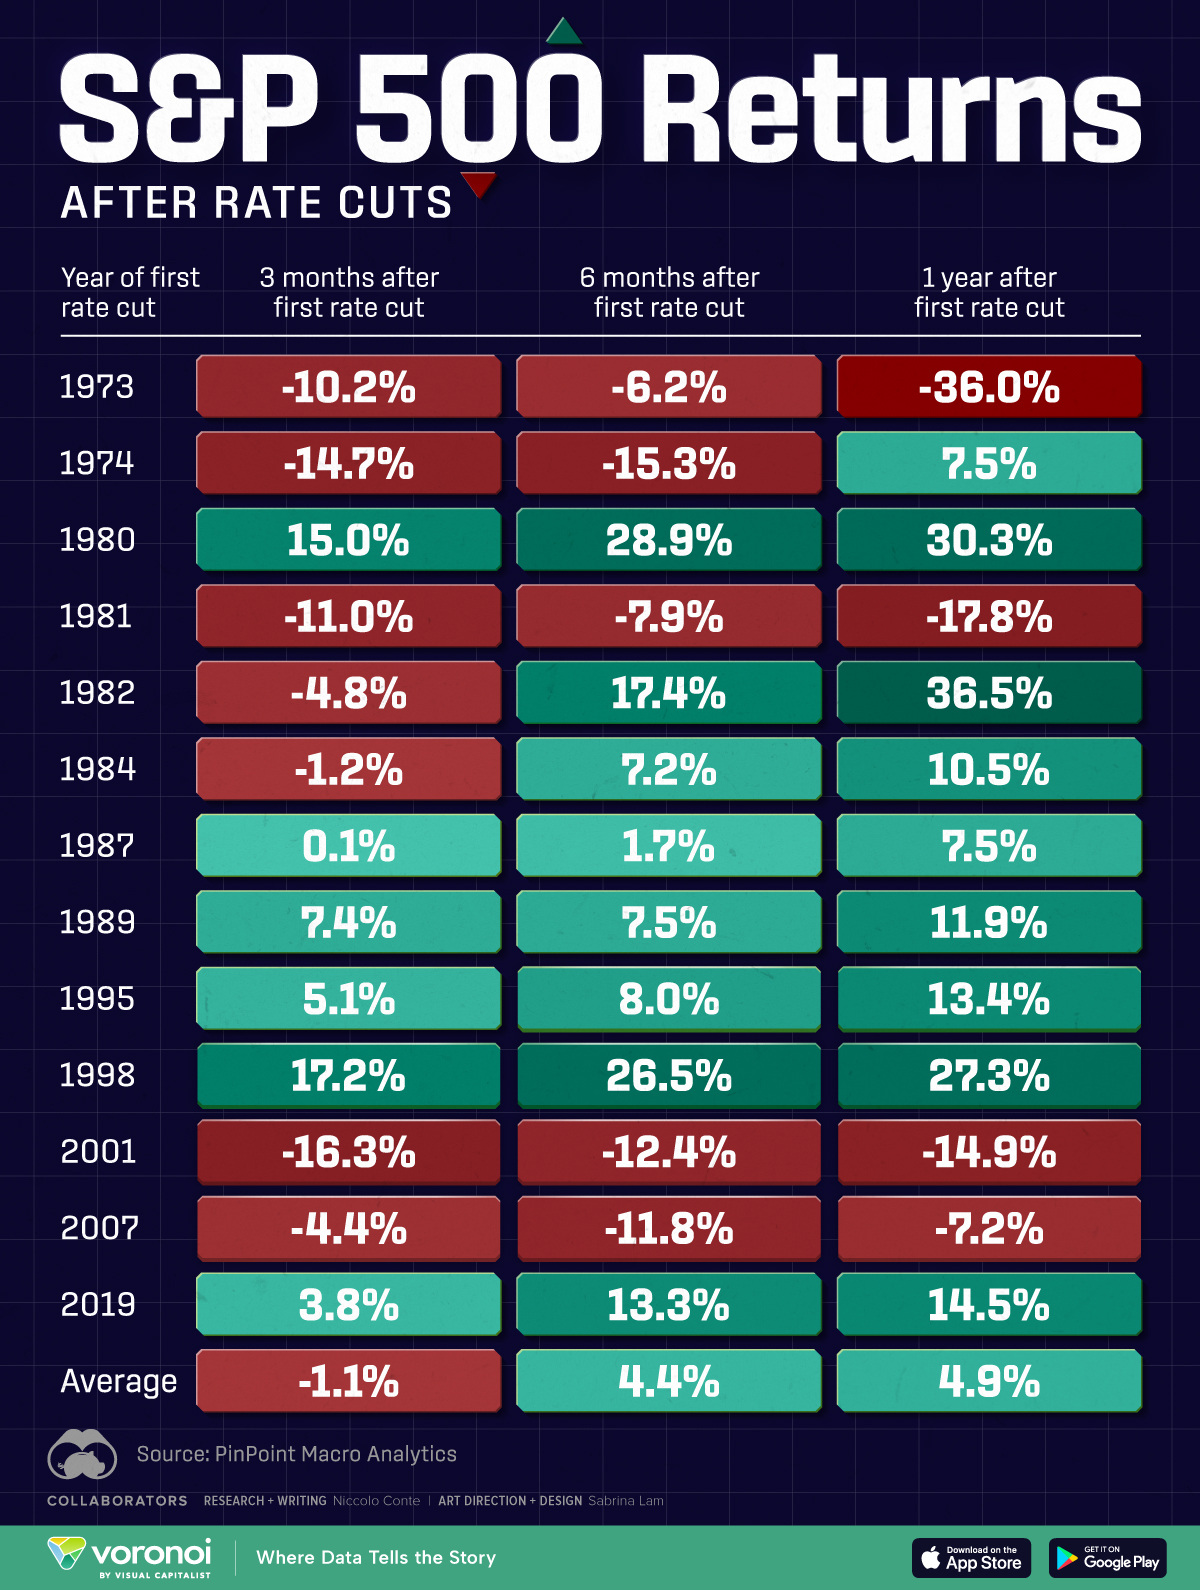
Today, weaker-than-expected economic data and easing inflation has strengthened the case for U.S. interest rate cuts for the first time since 2020.Although S&P 500 firms were largely protected from rising rates due to locking in lower rates in 2020 and 2021, many loans are up for renewal in 2025. While S&P 500 returns have typically been positive after rate-cutting cycles, these dynamics may present a unique scenario for corporate America. Sectors that benefited from securing low rates, such as manufacturing, may be most exposed to refinancing risks.This graphic shows S&P 500 performance after interest rate cuts since 1973, based on data from .
How Does the Stock Market React to Interest Rate Cuts?
Below, we show how the S&P 500 has performed after the first rate cut over the last five decades:Below, we show how the S&P 500 has performed after the first rate cut over the last five decades:
Historically, the S&P 500 returns 4.9% on average one year after the first interest rate cut, seeing positive returns nearly 70% of the time.In the three months following a rate cut, the market often dips, but typically rebounds by the six-month mark. This aligns with conventional wisdom that lower interest rates stimulate economic activity by reducing borrowing costs for businesses and consumers, which tends to benefit the stock market.However, S&P 500 performance following can vary significantly. For instance, U.S. equities saw double-digit declines after the first rate cuts in 1973, 1981, and 2001. On the other hand, the S&P 500 surged 36.5% one year after the 1982 rate cut cycle. In the most recent rate cut cycle, the S&P 500 jumped by 14.5% in the following year.In this way, interest rate cuts don’t show the whole picture. Instead, positive earnings growth may offer a more reliable indicator of S&P 500 performance in the following year. When earnings growth is positive, the market averages one year after. In contrast, when earnings decline during periods of falling interest rates, the S&P 500 increased by 7%, on average.More By This Author:Here Are The 10 Worst US States To Retire InSilver: The Unsung Hero Of The New EconomyRanked: The 10 Worst Countries for Women
