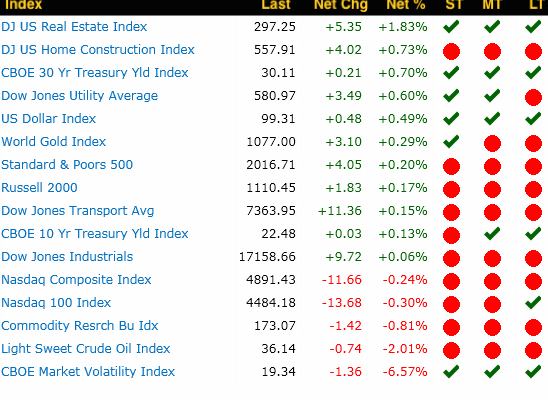
Performance Summary
*Trends: ST = short-term; MT = Intermediate-term; LT = long-term

Market Condition

Don’t be fooled by today’s price action. Equity markets have not stabilized yet. Although momentum showed signs of being less bearish, market internals remain weak. A significant number of stocks advanced on lower volume (distribution) while the majority of those declining in price did so on lower volume (apathy) as well. We’re still stuck in the mud until either bulls or ears decide to commit in volume.
Hillbent on the Market Direction…
| Daily Chart Technical Analysis |

| Market Breadth | ||||
| Advancers | 311 | Â | Decliners | 186 |
| New 5-day highs | 55 | Â | New 5-day lows | 103 |
| New 52-week highs | 4 | Â | New 52-week lows | 15 |
| Bullish reversals | 25 | Â | Bearish reversals | 109 |
| Market Momentum | |||
| % > 20 M.A. | % > 50 M.A. | % > 100 M.A. | % > 200 M.A. |
| 33% ↑ | 31% ↑ | 44% ↑ | 39% ↑ |
| ↑ = positive momentum; ↓ = negative momentum; and ↔ = neutral momentum | |||
Volume Radar Alerts
- Vol % = volume percentage greater than average volume
- SIR = short interest ratio or days to cover


