USDCHF has been moving sideways since the end of March. We see five price swings between two trend-lines that reminds us of a triangle formation. That’s an A-B-C-D-E pattern that occurs in the direction of a trend, so it’s a continuing formation suggesting further rise for USDCHF. In fact this bullish trend continuation is already here, after a recent bounce from 0.9470 and above the upper resistance line and wave D swing high. A move from the last two weeks is also sharp, so we see 1.0000 coming, but then even 1.0300-1.0400 in the months ahead.
USDCHD, Daily

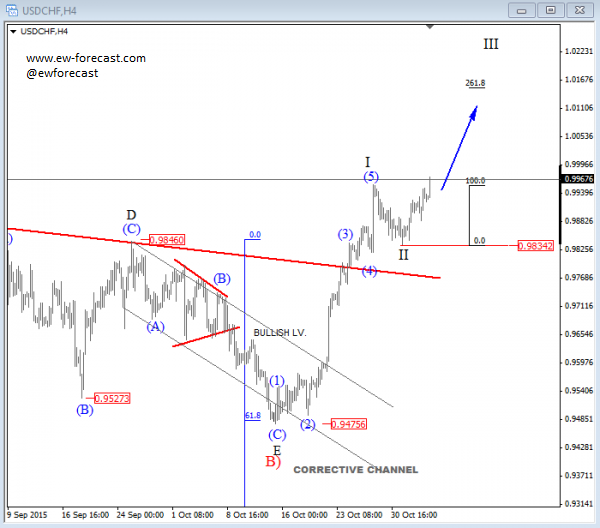
On the 4h chart, USDCHF is trading at new highs so we need to consider a continuation to higher levels as the pair can be at the start of wave III. There is room for a move up to around 1.0150 area in the next few days, while 0.9834 must hold. Any turn down back beneath 0.9850 will indicate an ongoing black wave II.
USDCHF, 4H

A Triangle is a common 5 wave pattern labeled A-B-C-D-E that moves counter-trend and is corrective in nature. Triangles move within two channel lines drawn from waves A to C, and from waves B to D. Triangles are overlapping five wave affairs that subdivide into 3-3-3-3-3.
Basic Triangle Pattern:


