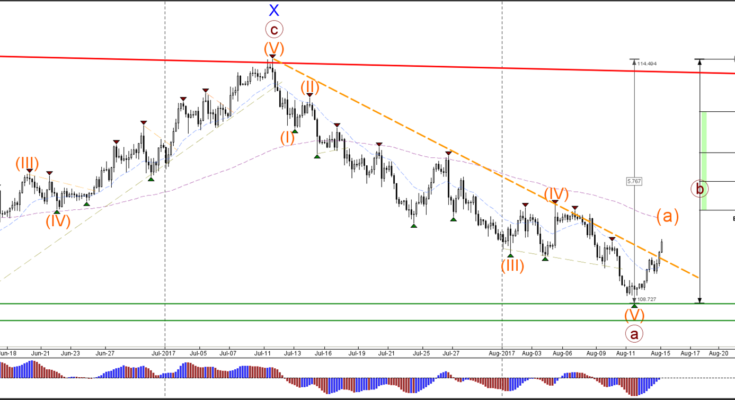
USD/JPY
4 hour

The USD/JPY bounced at the support zone (green lines) of the previous daily bottom and broke above the resistance trend line (dotted orange). The wave structure is therefore favoring a completion of the wave A (brown) at the newest low and the current bullish price action could be a wave A (orange) within wave B (brown).
1 hour

The USD/JPY is building a wave 5 (purple) within wave A (orange). Price could complete the wave 5 at the targets of wave 5 vs 1+3.
EUR/USD
4 hour

The EUR/USD made a bearish bounce at the Fibonacci levels of wave B vs A. The divergence between the tops (purple line) could create a larger bearish retracement via an ABC correction (purple). The main targets are the 23.6 and 38.2% Fibonacci levels of wave 4 vs 3. A break of the top and 100% Fibonacci level of wave B vs A at 1.1910 could indicate an uptrend continuation.
1 hour

The EUR/USD potential break above the resistance (red) of the triangle chart pattern could see price move towards the next 78.6% Fibonacci level of wave B vs A whereas a break below support (blue) could see price continue towards the 23.6% Fib of wave 4 (green).
GBP/USD
4 hour

The GBP/USD downtrend is building a pause by moving sideways between support (blue) and resistance (orange). A bearish breakout could indicate the continuation of wave 1 (red).
1 hour

The GBP/USD sideways zone increases the chance that the current pattern is a choppy wave 4 (purple) correction.
Â

