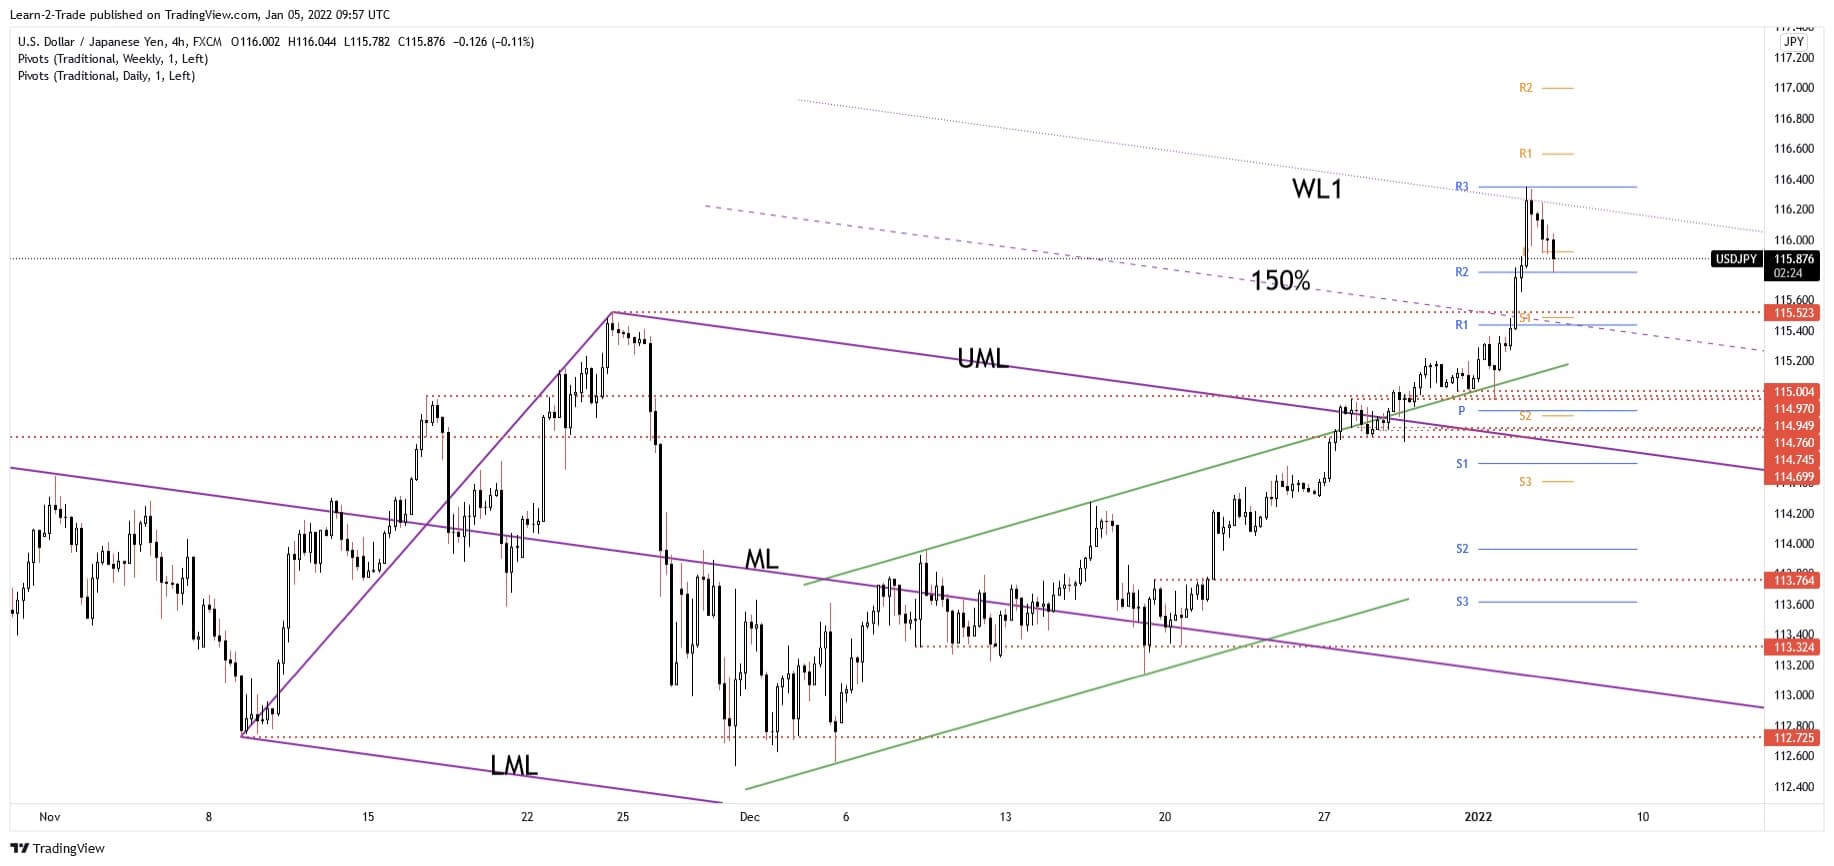
- The USD/JPY pair drops as expected after reaching the warning line (WL1).
- Its correction could be only a temporary one, the buyers could catch a new leg higher after the retreat ends.
- Coming back towards the 150% Fibonacci line could bring new buying opportunities.
Our USD/JPY forecast sees the pair moving into a corrective phase after its amazing rally. The price registered a strong leg higher, so a temporary decline is natural. It has raised as much as 116.35 in yesterday’s trading session where it has found resistance again.
3 Free Forex Every Week – Full Technical Analysis
Technically, the current retreat could help us to catch new long opportunities. In the short term, the rate could test and retest the immediate support levels before jumping higher. It has slipped lower as the Dollar Index retreated and also because the Japanese Yen Futures rebounded.
If you are interested in getting involved with automated forex trading, then begin your journey by reading our essential guide.
Fundamentally, the Japanese Consumer Confidence dropped from 38.2 to 39.1 points, even if the specialists expected a potential growth to 39.8 points, while the Monetary Base rose by 8.3% less compared to 9.5% expected.
Still, the US ADP Non-Farm Employment Change and the FOMC Meeting Minutes are seen as high-impact events and could really shake the markets. The economic indicator is expected at 405K in the last month while the FOMC Minutes report could be a hawkish one.
As you already know, the Federal Reserve is expected to hike rates several times during 2022, which could be good for the USD.
USD/JPY Forecast: Price Technical Analysis – Correction

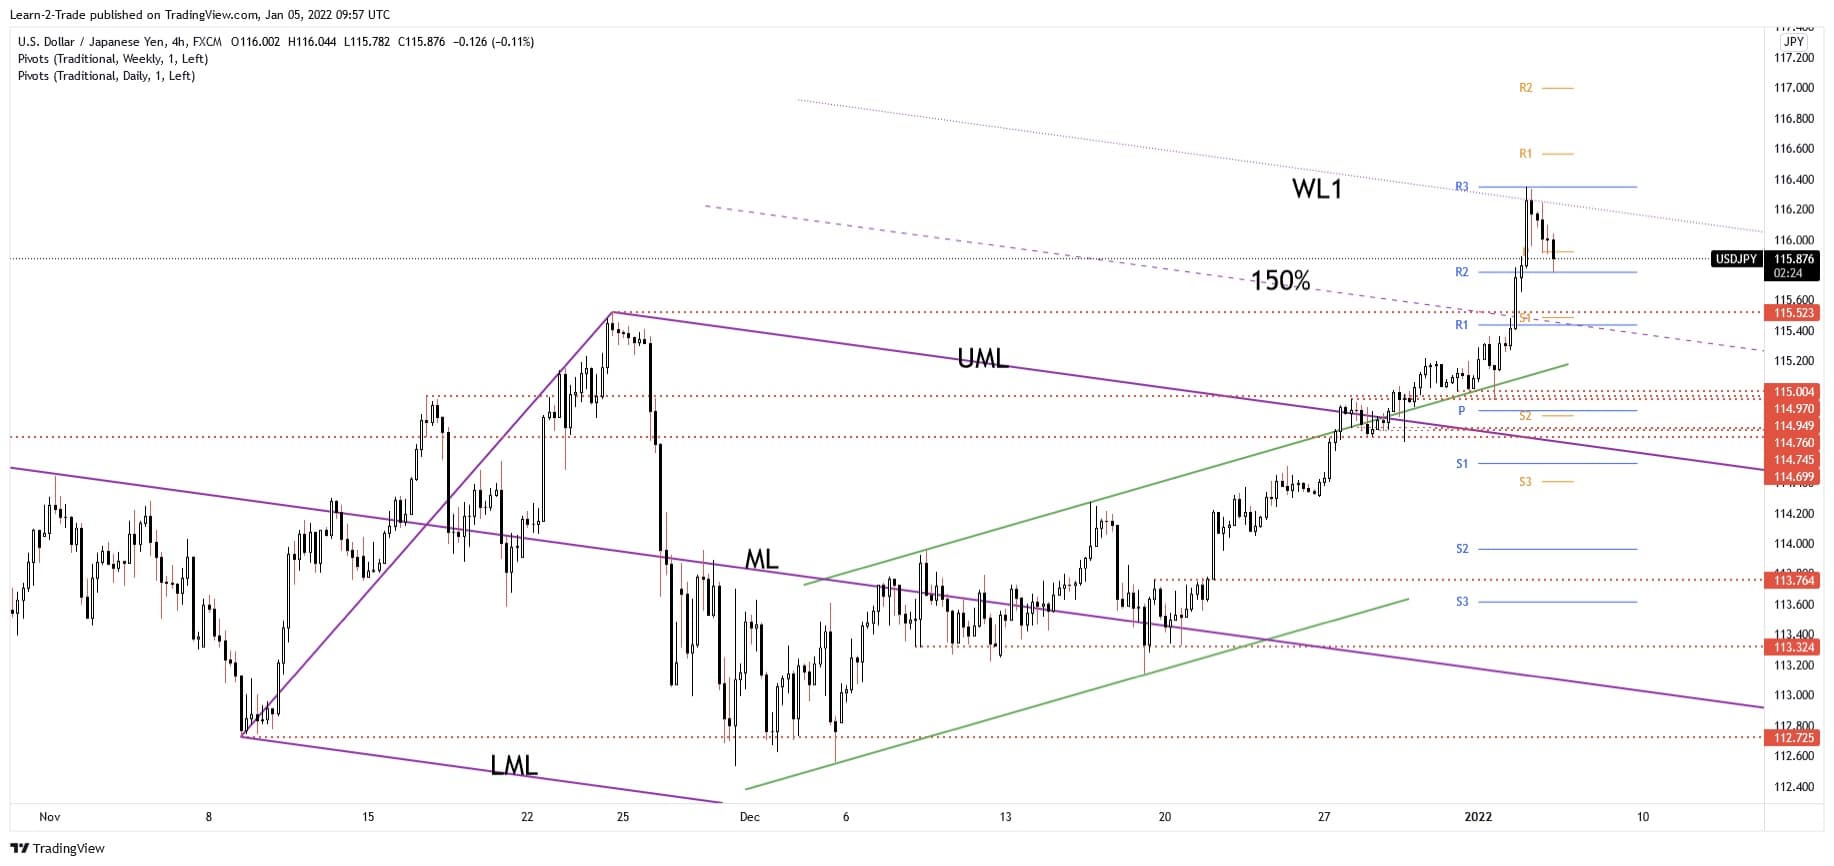
The USD/JPY pair extended its upwards movement after validating its breakout above the descending pitchfork’s upper median line (UML). The first warning line (WL1) which represented a major upside target was reached as expected after registering only false breakdowns with great separation below the upper median line (UML) and under the 114.97.
The bullish momentum was also stopped by the weekly R1 (116.35). Now, it challenges the 115.78 weekly R1. Closing and staying below it may signal further drop towards the 115.52 and down to the 150% Fibonacci line. The current drop could bring great buying opportunities.
Technically, the bias remains bullish despite the current sell-off. Personally, I will search for longs around the 115.50 level if the price comes back to reach it. Also, staying above the R2, making a consolidation could bring new long signals sooner.
Looking to trade forex now? Invest at eToro!
68% of retail investor accounts lose money when trading CFDs with this provider. You should consider whether you can afford to take the high risk of losing your money.


