BACK-LOADED ECONOMIC CALENDAR BRINGS RBNZ, BOE, US CPI
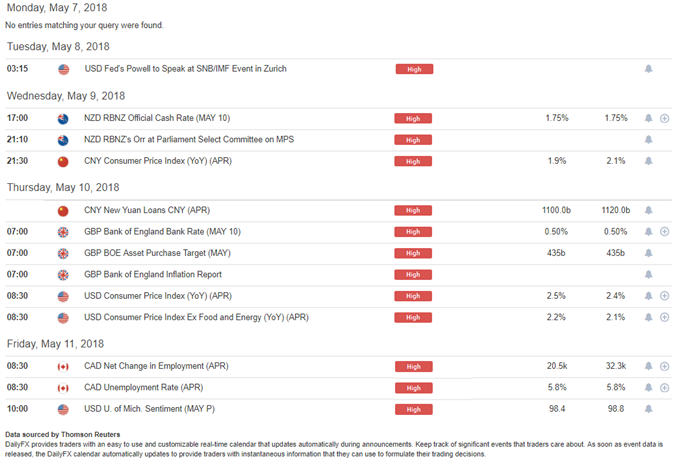
This week’s economic calendar is back-loaded, with a series of high-impact events on the docket for later in the week with a lighter outlay up front. On the Central Bank side of the coin, we have an RBNZ rate decision on Wednesday followed by a ‘Super Thursday’ event from the Bank of England on Thursday morning. Given the aggressive weakness that’s shown in the British currency since mid-April, this event will very much be in the spotlight. Also of pertinence will be inflation prints out of China (Wednesday night) and the US (Thursday morning), followed by Canadian employment numbers on Friday.
DAILYFX ECONOMIC CALENDAR: HIGH-IMPACT EVENTS, WEEK OF MAY 7TH, 2018

Prepared by James Stanley
US DOLLAR OPENS WEEK AT 2018 HIGHS
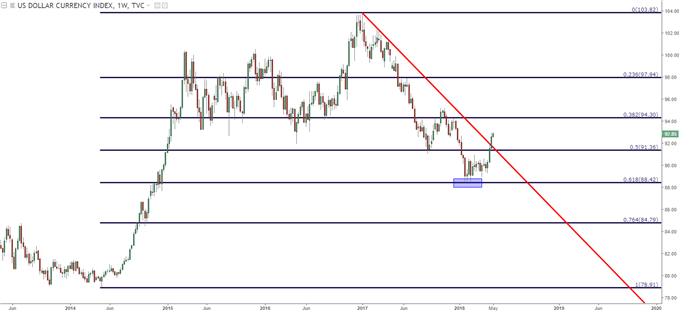
Coming into April, the US Dollar down-trend had been going for well over a year, and this was happening as the Federal Reserve was one of the few Central Banks actually hiking rates. The fact that this down-trend was so pronounced despite the fact that the Fed was one of the few hawkish CB’s out there alluded to the fact that there was something else doing the pushing; and from the January, 2017 high to the February 2018 low, the US Dollar had lost as much as 15% of its value. This was an approximate 61.8% retracement of a previous bullish trend that ran from 2014 to 2017, and after hitting support there in mid-February, the Greenback oscillated back-and-forth as we closed Q2 and moved into April.
US DOLLAR WEEKLY CHART: THREE WEEKS OF STRENGTH, 61.8% RETRACEMENT OF 2014-2017 MAJOR MOVE

Chart prepared by James Stanley
Since mid-April, however, the US Dollar has displayed a far different tonality. Many are attributing the Dollar’s recent bullish breakout to stronger forces of inflation, and while the higher rates of inflation are true, that doesn’t necessarily mesh with US Dollar price action. March inflation numbers were released on April 11th, and USD weakness continued into April 17th, at which point DXY found support at a bullish trend-line while setting a low around 89.23. And this is when UK inflation figures for March came out to a disappointing tune, bringing an aggressive reversal into GBP/USD, and this is when USD strength really started to show.

