(Click on image to enlarge)
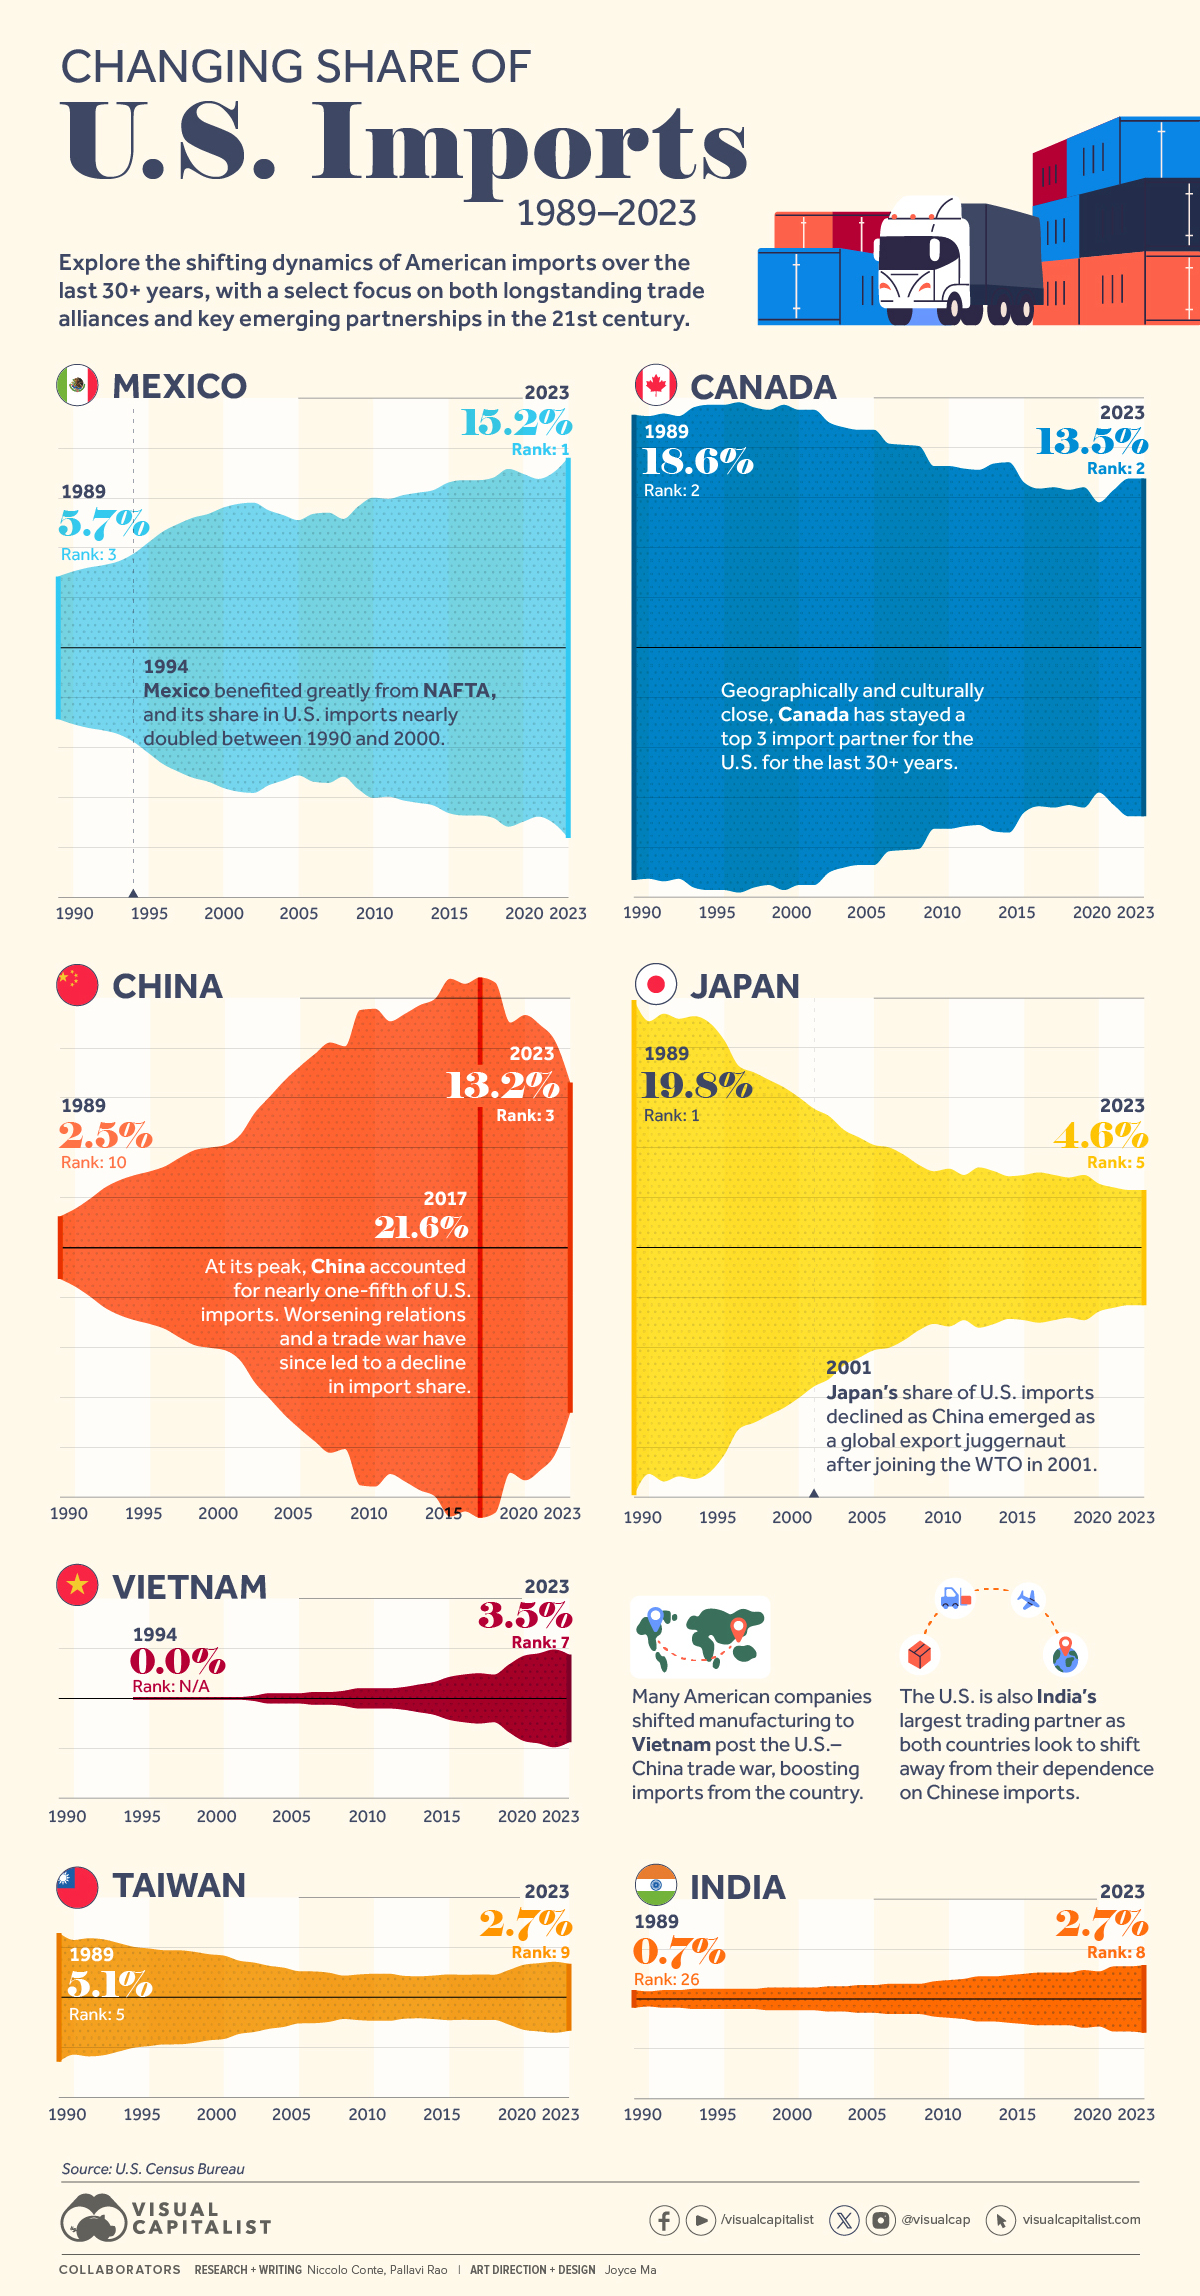
Since 1989, the U.S.’ largest trade partner by share of imports has changed four times.Similarly, the top 10 ranking of importers has seen a shuffle as well, as some countries gain share and eclipse rivals due to favorable trade policies and economic conditions.We highlight the changing fortunes of seven select countries—past alliances and emerging partnerships—that are major sources of U.S. trade, using from the U.S. Census Bureau.
Seven Major Sources of U.S. Trade (1989–2023)
Neighbors, allies, former enemies, and rivals make for an all-star cast.
As the U.S.’ closest land neighbors, Canada and Mexico have been amongst the country’s largest trade partners for many years. Along with their geographic proximity, the key North Atlantic Free Trade Agreement (NAFTA) which took effect in 1994, allowed the free movement of goods across the three countries.Mexico in particular benefited greatly from NAFTA, and has become the primary source of agricultural products for both the U.S., and Canada. In 2022 the country overtook China to become the U.S.’ largest source of foreign goods and services after the EU, at 15.2% of import share. Both countries together account for one-third of all U.S. inbound trade.
Japan’s post-war economic boom reached its zenith by the late 1980s and Asia’s largest economy at the time was also the largest source of U.S. inbound trade, accounting for nearly one-fifth of U.S. imports on its own.However, by the mid-1990s, the Japanese economy entered a period of stagnation, and along with the signing of NAFTA, which boosted both Canada and Mexico, Japan’s share of U.S. inbound trade started slipping. After 2001, when China joined the World Trade Organization, Japan’s share of U.S. imports dropped even further to 4.6% in 2023.
China’s rapid export rise in the 2000s singlehandedly defined the country as the world’s manufacturer. Between 2001–2022, to the U.S. grew nearly 1,000% to $600 billion. In 2017 the country was the source of more than one-fifth of all U.S. imports. However, the U.S.-China trade war kicked off by the Trump administration reduced China’s share in U.S. inbound trade (down to 13.2% in 2023) as other economies in South and Southeast Asia have grown to become manufacturing hotspots in the last few years.
Emerging Partnerships Diversify Sources of U.S. Trade
Vietnam in particular has benefited hugely from the U.S. (and other countries) turning away from China. The country prioritized education to turn its large population into a skilled workforce. As a result, Vietnam has jumped up the ranks of the top sources of U.S. imports, coming in 7th in 2023. This is contrasted with not even having trade relations with the U.S. in 1989, a policy remnant from the Vietnam War.India has also found a niche as a source for gold and jewelry for the United States. With rumors of American companies shifting manufacturing to the 5th largest economy in the world, their share in U.S. imports may only further increase.Meanwhile, Taiwan which prioritized an export-oriented economy since the 1950s has also been losing share in the U.S.—their biggest export market in 1990. The rise of China, and subsequently Vietnam, Indonesia, and Thailand, has altered the which ships semi-finished goods to its neighbors, from where they eventually make their way to the United States.More By This Author:

