This week we’ll begin with our monthly and weekly forecasts of the currency pairs worth watching. The first part of our forecast is based upon our research of the past 11 years of Forex prices, which show that the following methodologies have all produced profitable results:
- Trading the two currencies that are trending the most strongly over the past 3 months.
- Assuming that trends are usually ready to reverse after 12 months.
- Trading against very strong counter-trend movements by currency pairs made during the previous week.
- Buying currencies with high interest rates and selling currencies with low interest rates.
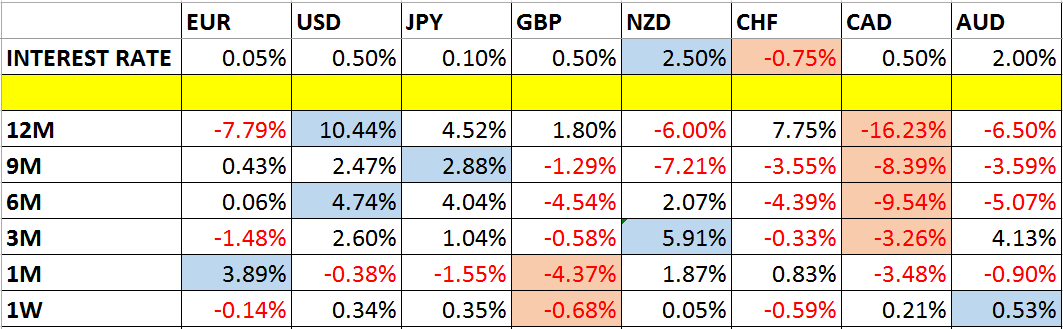
Let’s take a look at the relevant data of currency price changes and interest rates to date, which we compiled using a trade-weighted index of the major global currencies:

Monthly Forecast January 2016
This month, we forecast that the USD will rise against the GBP, CHF and CAD, suggesting long USD/CHF and USD/CAD and short GBP/USD trades.
Weekly Forecast 3rd January 2016Â
Last week, we made no weekly forecasts.
This week, we again make no forecasts, as there were no strong counter-trend moves last week.
This week saw strength in the commodity currencies of NZD, AUD and CAD, as well as safety currencies such as the USD and JPY. The European currencies were weak, especially the GBP.
Volatility was a little higher compared to the previous week. Approximately 63% of the major and minor currency pairs changed in value by less than 1%. Volatility is likely to increase sharply this week, as we begin a new year with several very crucial items of U.S> economic data due.
Key Support/Resistance Levels for Popular Pairs

Let’s see how trading one of these key pairs last week off could have worked out:
AUD/USD
We had expected the level at 0.7279 might act as resistance, as it had acted previously as both support and resistance. Note how these “flipping†levels can work really well. The H4 chart below shows how during last Monday’s Asian session, right at the weekly open, the price tried to rise above the level and failed, and then formed a bearish inside candle marked by the down arrow, which immediately broke down. However this trade only gave a reward to risk ratio of about 1:1 as it turned around to the upside again at a level of previous minor resistance at around 0.7245. Note how both of these levels can now be treated as potential support due to recent bullish price action.
