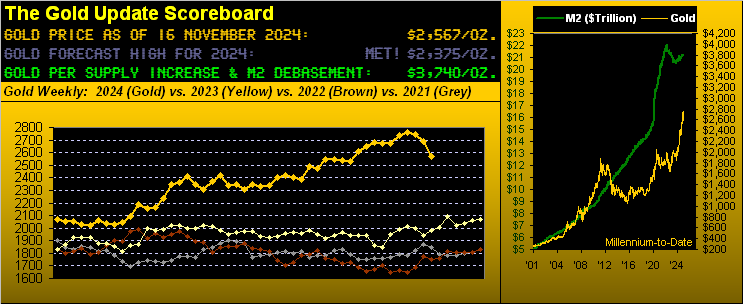
For you valued regular readers of The Gold Update, price’s demise across these past three weeks ought be no surprise. Into Halloween week, Gold vis-à-vis its near-term smooth valuation line ran better than +150 points “too high”. Then into the StateSide election, price — as herein penned a week ago — once trumped was then dumped.Subsequently, Gold fully reverted south to said smooth valuation mean, and upon penetrating it to the downside, the stage was set (as is the rule of thumb) for still lower prices, our “average” anticipation level (as herein written last week) being 2555. And indeed such price was reached this past Thursday en route to the week’s low of 2542, toward settling yesterday (Friday) at 2567. Here’s Gold’s updated Market Values graphic from one year ago-to-date. Therein note per the lower panel oscillator (price less valuation) whereas Gold by this near-term metric was “overvalued” back in April by +200 points, that ’tis now “undervalued” by half that distance at -100 points. The wee “sell” label marks the crossover:
However, with respect to Gold’s weekly parabolic trend, we’d last written: “…there’s a very realistic chance that in a week’s time we’ll herein find such trend having flipped to Short…” which in concert with price’s reversion to the smooth valuation line has also come to pass. Here are the updated weekly bars, the rightmost encircled red dot confirming the commencement of the new parabolic Short trend: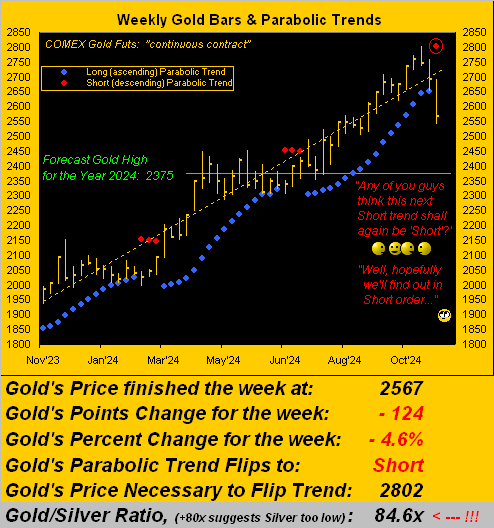
‘Course, the buzz within the graphic reminds us that Gold’s prior three weekly parabolic Short trends (extending as far back as September a year ago) have each been just three weeks in duration. But given current negative technical reads — plus fundamental Federal Reserve musings that continuous rate cuts are not necessarily in stone (especially should inflation be increasing its tone) — the notion of yet another Short trend of short duration may be short-lived.But wait, there’s more (or contextually stated given price’s descent, “less“). Whilst too few in the trading community at large follow deMeadville’s leading analytics, a technical study very visible to the otherwise “great unwashed” is the mouthful measure “moving average convergence divergence” (MACD), an expression of complexity tossed about over post-work martinis to impress those within ear-shot as “MAC-DEE”: “Well ya know, the big guy and me always buy to the max using MAC-DEE!” Oh gee.Regardless, MACD is one of the five key “standardized” Market Rhythms (across 405 nightly studies) we run here at deMeadville. And by Gold’s weekly candles, the MACD — along with price’s piercing of the smooth valuation line and parabolic trend flipping to Short — also just confirmed its own negative crossover as we rightmost next see: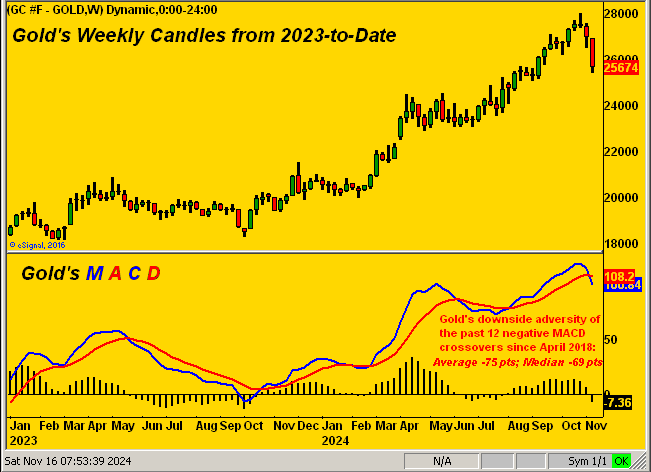
So in again teeing off on Squire’s “How low is low?” query from a week ago, the above graphic depicts the amount of adversity one might expect from the present 2567 level, the “average” -75 points suggesting Gold revisiting the upper 2400s on this run. Indeed doing the math across Gold’s price-structuring cluster from 03 May’s low of 2285 to 20 May’s high of 2454, the mid-point is 2370. And as you seasoned techies know, cluster mid-points are oft ripe targets.“So mmb, you’re saying another 100 points down from here is where Gold is going?’”As you know, Squire, none of us ever know. We can only put to use that which typically eventuates so as to have some degree of cash management guidance.“But folks should still wait to buy, eh mmb?”Our modus operandi (a little Latin lingo for you WestPalmBeachers down there) for buying into dips is to accept the risk (especially with respect to Gold) of getting aboard with an initial tranche, but budgeting to fully expect another buying opportunity further down. In other words, by planning to be initially wrong, one doesn’t miss out when it all goes right. To again reprise the resplendent Richard Russell: “There’s never a bad time to buy Gold.” And priced today at 2567 vis-à-vis the opening Scoreboard’s Dollar debasement level of 3740, obtaining Gold at a -31% discount to its long-term value ought be an attractive entry point for those of you scoring at home.Speaking of scoring, the Dollar Index just completed its seventh consecutive weekly gain, en route reaching to as high as 106.990, a level not traded since 03 October of a year ago. And as we approach the 15th anniversary of these weekly Saturday missives (since 21 November 2009), we’ve on occasion quipped that provenly “Gold plays no currency favourites”, albeit price typically trends contra-Dollar as has been the recent case.To be sure, pre-election Gold was being grabbed as a safe-haven bid, in concert too with the Fed to that point having turned somewhat benevolent. But so-called oxymoronic “Dollar strength” has a tendency to erode all eight elements of the BEGOS Markets (Bond, Euro/Swiss, Gold/Silver/Copper, Oil, S&P 500). In fact during these recent days wherein a glance at the screen portrays all eight components in the red, we “know” a priori that the Dollar Index is higher. ‘Tis just the way these markets both interact and react.Moreover with respect to being in the red, the mighty S&P 500 (aka “Casino 500”) — which though this year’s first 42 weeks (to that ending 19 October) had net gains in two of every three — just recorded its third down week in the last four. (Recall the Wall Street Journal piece pre-DotComBomb about less-experienced investors actually believing the stock market never went down?) Yet, just how overvalued remains the S&P, even having lost -2.7% (high-to-low) in just past five trading days? Technically, the Index through Friday is still “textbook overbought” through 23 of the past 27 trading days. Fundamentally, the “live” price/earnings ratio is a whopping 44.4x. But then again, portfolio theory has long-been passé: either be a lemming, else be left behind.Which brings us to the Economic Barometer, itself continuing to improve. And per today’s conventional wisdom, as things get better, the S&P gets worse: because rather than earnings-driven, the contemporary market is Fed-driven. And as aforenoted, the Fed is now conditioning the market so as not to expect the FedFunds rate to automatically be cut time and again.Specific to just this past week, of the Econ Baro’s 14 incoming metrics, only four did not improve period-over-period, albeit those laggards included October slowing in both Retail Sales and Capacity Utilization. But the month’s wholesale inflation (Producer Price Index) popped — which is a Baro positive, “the rising tide of inflation lifting all boats” — whilst rate shrinkage was reduced for both Industrial Production and September’s Business Inventories. Too, November’s NY State Empire Index whirled ’round from -11.9 to +31.2, its largest month-over-month improvement since COVID-laced June in 2020. Thus, up with the economy, down with the S&P: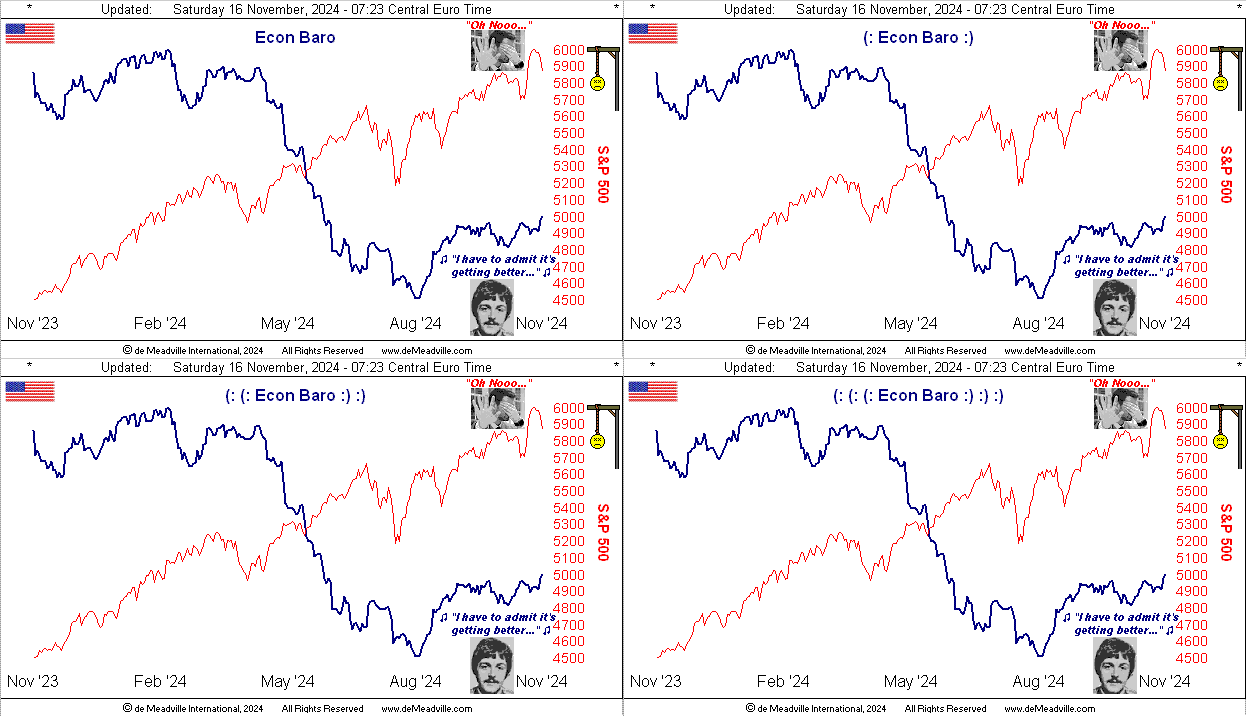
Further as noted, when the Buck gets the bids, “everything else” goes on the skids, including ‘natch the precious metals. ‘Tis not the happiest of two-panel displays, but here next are the last three months-to-date of daily bars for Gold on the left and for Silver on the right, along with their respective baby blue dots of trend consistency. Cue our lead (pun intended) conductor with “Follow the Blues instead of the news, else lose yer shoes…“: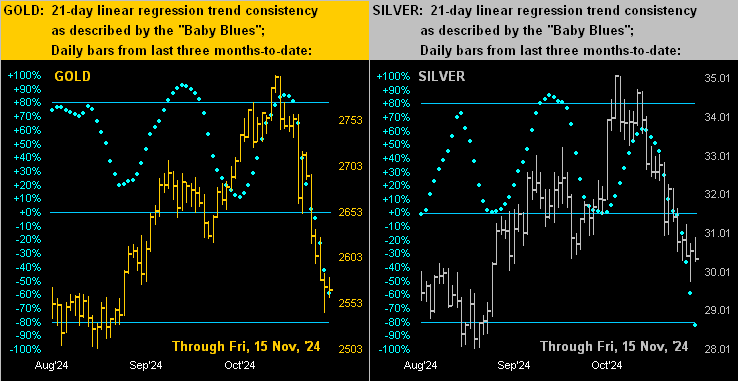
Too, we’ve the precious metals’ 10-day Market Profiles, price in both cases nearly buried at the bottom of each stack for Gold (below left) and Silver (below right). The more dominant overhead volume prices are as labeled: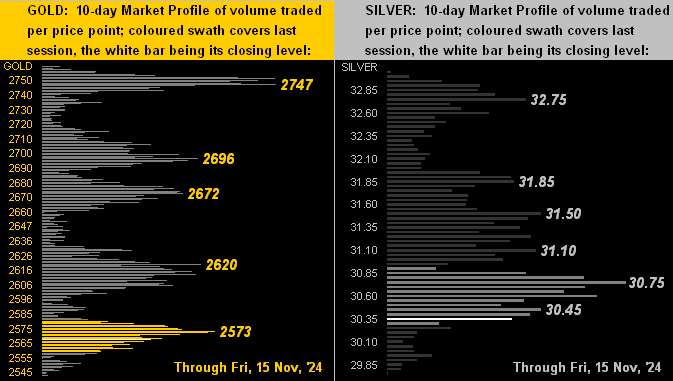
And so to wrap, let’s go with The Stack:The Gold Stack
Gold’s Value per Dollar Debasement, (from our opening “Scoreboard”): 3740
Gold’s All-Time Intra-Day High: 2802 (30 October 2024)
2024’s High: 2802 (30 October 2024)
The Weekly Parabolic Price to flip Long: 2802
Gold’s All-Time Closing High: 2799 (30 October 2024)
10-Session “volume-weighted” average price magnet: 2656
Trading Resistance: notable Profile nodes 2573 / 2620 / 2672 / 2696 / 2474
Gold Currently: 2567, (expected daily trading range [“EDTR”]: 43 points)
10-Session directional range: down to 2542 (from 2759) = +217 points or -7.9%
Trading Support: none notable per the Profile
The 300-Day Moving Average: 2268 and rising
The 2000’s Triple-Top: 2089 (07 Aug ’20); 2079 (08 Mar’22); 2085 (04 May ’23)
2024’s Low: 1996 (14 February)
The Gateway to 2000: 1900+
The Final Frontier: 1800-1900
The Northern Front: 1800-1750
On Maneuvers: 1750-1579
The Floor: 1579-1466
Le Sous-sol: Sub-1466
The Support Shelf: 1454-1434
Base Camp: 1377
The 1360s Double-Top: 1369 in Apr ’18 preceded by 1362 in Sep ’17
Neverland: The Whiny 1290s
The Box: 1280-1240‘Tis a fairly light, ensuing week for incoming Econ Baro metrics, the most attention-getting one to be the Conference Board’s compiled negative reading of October’s Leading Indicators, (which as led by the Baro we instead refer to as “Lagging”). Too, ’tis the final week of Q3 Earnings Season, which as you know (should you follow its page and/or read the Prescient Commentary) is sub-par compared to average quarterly year-over-year improvement. But as we’ve quite a bit quipped, earnings today are irrelevant to equities’ investing: else the S&P 500 would be at but half its current level.Otherwise, notwithstanding some further near-term demise, Gold remains ever so cheap for the wise … the bottom line thus being:Got Gold? Don’t be a chicken! Get yourself some real nuggets and win! More By This Author:
‘Tis No Surprise, Gold’s Current Demise

