While most dividend strategies underperformed their respective benchmarks in 2023, the ® impressively outperformed the by approximately 3.50% (see Exhibit 1). Furthermore, despite the outperformance, the S&P Pan Asia Dividend Aristocrats’ valuations and dividend yield remained favorable relative to the benchmark (see Exhibits 3 and 4). This blog will examine these metrics in more detail, in addition to providing a detailed performance attribution for 2023.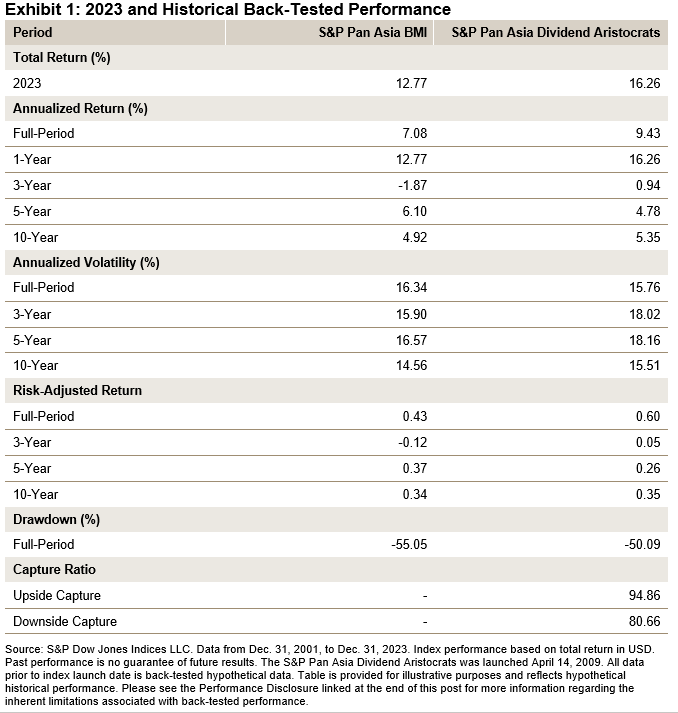
As Exhibit 1 shows, the S&P Pan Asia Dividend Aristocrats’ strong 2023 performance further boosted its long-term outperformance versus the S&P Pan Asia BMI. Going back to Dec. 31, 2001, the S&P Pan Asia Dividend Aristocrats has outperformed the S&P Pan Asia BMI on average by 2.35% annually. Additionally, this long-term outperformance has been achieved while also delivering a lower full-period volatility, maximum drawdown and downside capture ratio.(Click on image to enlarge)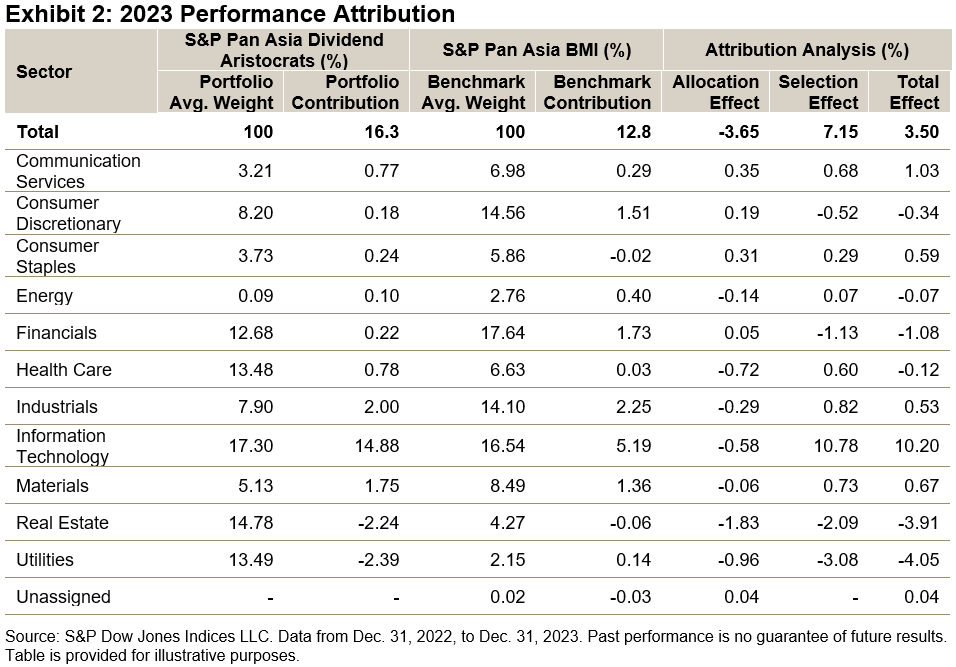
Exhibit 2 displays the 2023 performance attribution for the S&P Pan Asia Dividend Aristocrats and S&P Pan Asia BMI. As shown in the attribution analysis columns, the total outperformance totaled 3.50%, with 7.15% due to the bottom-up stock selection effect and -3.65% from the allocation or sector effect. Information Technology was the largest positive-contributing sector for the S&P Pan Asia Dividend Aristocrats, at 10.20%, with 10.78% from the selection effect and -0.58% due to the allocation effect.The key differentiator of the S&P Pan Asia Dividend Aristocrats versus its benchmark is the requirement that stocks must increase dividends per share for at least seven consecutive years. This filter, in addition to the payout and dividend yield filter, may bias the index toward selecting higher quality stocks since the ability to consistently grow dividends over the long term can be an indication of financial strength and discipline.(Click on image to enlarge)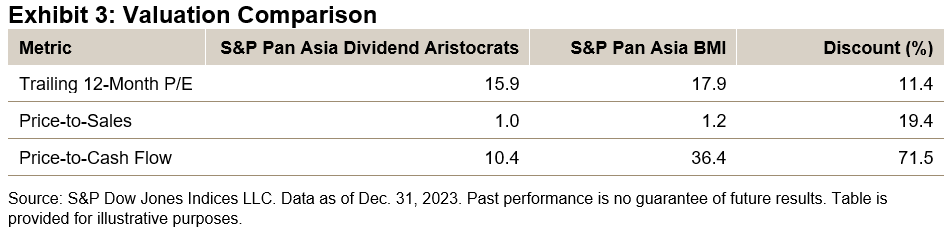
Exhibit 3 displays the valuation comparison and discount of the S&P Pan Asia Dividend Aristocrats versus its benchmark. The index is cheaper on all three metrics shown, with an average discount over the three metrics at approximately 34%. Not shown in the table but important nonetheless, is the return-on-equity (ROE) metric, which measures how efficiently a company utilizes shareholder capital to generate net income. The S&P Pan Asia Dividend Aristocrats has a 9.9% ROE versus 9.1% for the S&P Pan Asia BMI as of Dec. 29, 2023.(Click on image to enlarge)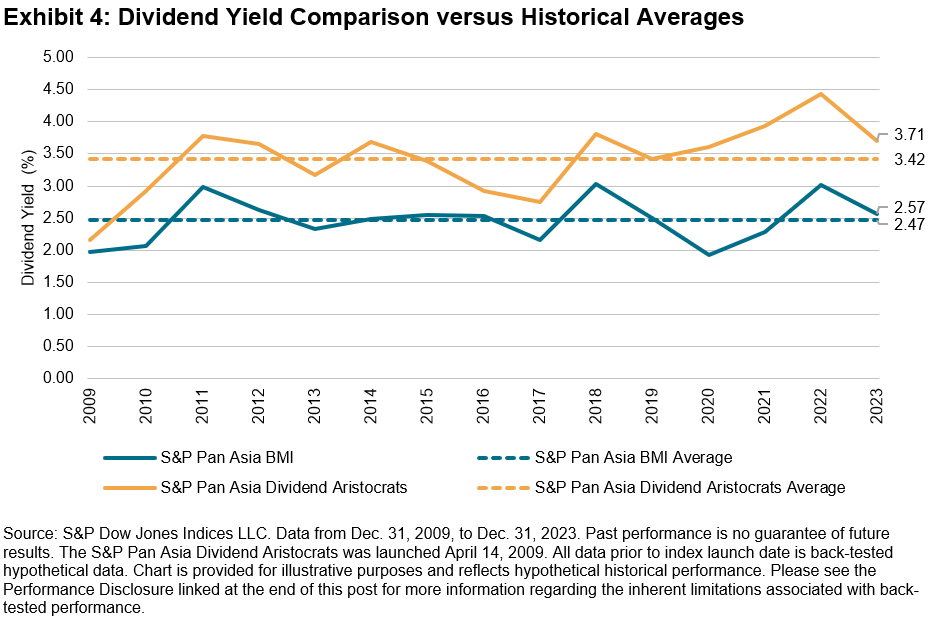
As Exhibit 4 shows, the index’s dividend yield has been higher than the Pan Asia BMI’s dividend yield every year since 2009. Furthermore, the average dividend yield for the S&P Pan Asia Dividend Aristocrats was 3.42% versus 2.47% for the S&P Pan Asia BMI over this period. Interestingly, the year-end 2023 dividend yield for the S&P Pan Asia Dividend Aristocrats was 3.71%, 8.40% higher than its historical average versus the S&P Pan Asia BMI’s year-end 2023 dividend yield of 2.57%, only 4% higher than its historical average.
Conclusion
Following a strong year of performance in 2023 thanks to its effective bottom-up stock selection, the S&P Pan Asia Dividend Aristocrats heads into 2024 holding a dividend yield and valuation advantage over its benchmark. For investors seeking an index with these value and dividend yield exposures, in addition to various quality and dividend filters, the S&P Pan Asia Dividend Aristocrats Index is an option to consider.More By This Author:
The S&P Dividend Aristocrats Remain Benchmark Beaters In Pan Asia

