Before August 2007, US$ money markets operated efficiently and predictably. They behaved according to a rigid hierarchy, which is a good thing no matter how it may sound. This inflexibility in the context of funding markets was exactly what we would want.
Arbitrage opportunity was responsible for enforcing the rules. One simple example was the difference between repo and federal funds. If the latter was transacting at X, we could be reasonably sure that the GC repo rate was some small spread below X. It made intuitive sense given how federal funds is overnight unsecured while repo is overnightsecured. You pay less interest for posting collateral; your counterparty accepts less interest for the collateral posted.
If either rate started to stray, there were large money dealing firms who could take advantage. If federal funds were to fall below the repo rate for whatever reason, a bank or non-bank participant could borrow in federal funds and simultaneously lend in repo. The result would be the two rates moving back to where they belong. This is one example of covered interest parity (CIP), or the internal behavior of money dealing that used to create, again, efficient and predictable money markets.
Absent CIP, money dealers not only wouldn’t know when to act, they wouldn’t really know how. If there is no hierarchy, where “should†the repo rate trade? If you don’t know the answer to that question, you can’t really classify anything related to it as arbitrage. It’s all just a muddle.
That hierarchy had proposed a seamless, single money market operation spread all over Earth. In actual fact, however, US$ markets were never so monolithic; anyone might have thought they were simple because covered interest parity in practice closely matched it in theory. To accomplish this “magic trick†merely required money dealing banks to employ sufficient balance sheet capacity over every timescale.
Nowadays, not so much. Over the past few months, the repo rate is well above EFF and even more than IOER. Why? The FOMC and the conventional “wisdom†hands us T-bills as the answer.

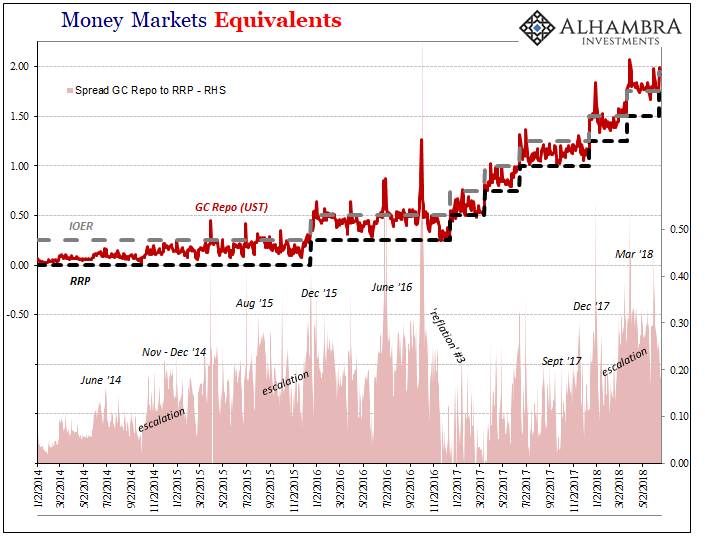
The problem with that theory is immediately recognizable on any chart that examines a period longer than just this year. The relationship between GC repo (UST collateral) and the RRP (for the sake of consistency, as you’ll see below, I’m using the spread of GC over RRP) outlines prior trends that have had nothing to do with T-bills or QT.
