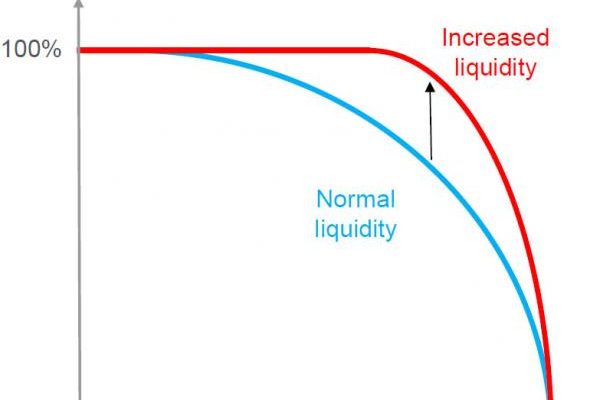
The following chart, courtesy of Citigroup, demonstrating the liquidity cliff i.e., the impact of a liquidity bubble on price and risk, is so mindbogglingly simple, it is no wonder that virtually nobody gets it.
As Citi observes, all a liquidity tsunami does for credit, as well as for equity, is to perpetuate the illusion of maximum pricing while shifting the risk curve to the point where any deviation from “perfection” – or loss of faith in the liquidity or its providers (as in central banks who in 2015Â are finally going “all in”) will ultimately lead to an instantaneous waterfall in price.

Which also explains why lately the exchanges have all been practicing how to most efficiently shut down when the “waterfall” moment arrives. Because if there is no market, one simply can’t sell.

