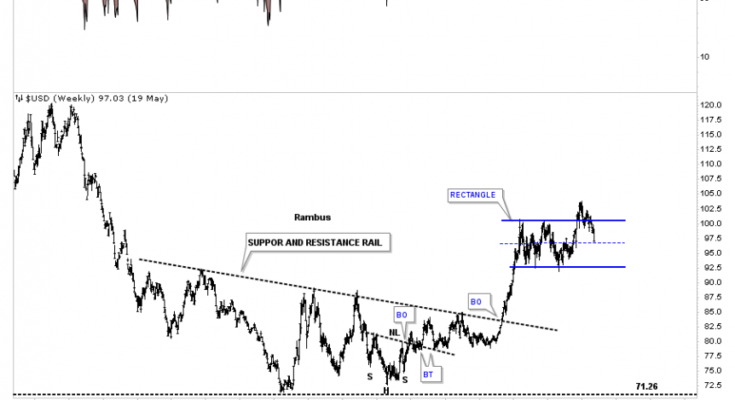
There is no doubt that the US dollar looks bad right now after breaking below the bottom rail of its 5 point falling wedge last week. Before I give up totally on the US dollar there is one thing I’m going to look for first. When all else fails I like to go back to the initial pattern which was a sideways trading range or a rectangle pattern. I’ve seen in the past that when you have a nice tight rectangle with a breakout above the top rail, there can be one very big shakeout move where the price action will decline back to the center mid dashed line, where final support may reside. If the dashed mid line fails to hold support then there are bigger problems. Below is a weekly chart for the US dollar which shows the price action testing the mid dashed center line.

The $US dollar daily line chart.

The daily chart below shows a potential downtrend channel with 2 blue consolidation patterns. If the blue bearish falling wedge is a halfway pattern to the downside the blue arrows shows a price objective down to the 96.20 area, which is labeled impulse move. The breakout to breakout price objective is a littler lower at 95.45. Those 2 price objectives come in pretty close to the mid dashed center line on the rectangle pattern above.

This weekly chart shows how the downtrend channel fits into the bigger horizontal trading range, which is now testing the dashed mid line. A break below the dashed mid line will most likely lead to a move down to the bottom of the rectangle.

The million dollar question remains, is the 2 year trading range a top or a consolidation pattern to the upside?

Below is a daily chart for the UUP which shows the original 5 point bearish falling wedge. I added a parallel bottom rail to the top rail which shows a possible bull flag if the bottom rail at the 24.85 area holds support.

This next chart for the UUP is the same chart as the one above, but this one shows the 2 smaller blue consolidation patterns that make up the downtrend channel up to this point.. If the lower blue bearish falling wedge is a halfway pattern between the blue bearish rising wedge, the blue arrows show a price objective down to the 24.87 area. Likewise, if the blue bearish falling wedge is a halfway pattern the BO to BO price objective is down to the 24.73 area.

