How bullish and bearish forces align for stock indexes, forex and other global markets, both technical and fundamental outlooks, likely top market movers and lessons for the market week ahead.
Summary
–Technical Outlook: Divergences between US, Asia, and Europe and messages from the charts about what is and isn’t driving markets
–Fundamental Outlook:  Lessons on what is, and isn’t behind the trends on the weekly index charts
–What To Monitor This Week And Beyond: Sources of potential market movers
The following is a partial summary of the conclusions from the fxempire.com weekly analysts’ meeting in which we cover the global market outlook for the coming week, both lessons and potential market movers to watch.
Technical Picture
We look at the technical picture first for a number of reasons, including:
Chart Don’t Lie: Dramatic headlines and dominant news themes don’t necessarily move markets. Price action is critical for understanding what events and developments are and are not actually driving markets. There’s nothing like flat or trendless price action to tell you to discount seemingly dramatic headlines – or to get you thinking about why a given risk is not being priced in
Support, resistance, and momentum indicators also move markets, especially in the absence of surprises from top tier news and economic reports.
Overall Risk Appetite Medium Term Per Weekly Charts Of Leading Global Stock Indexes

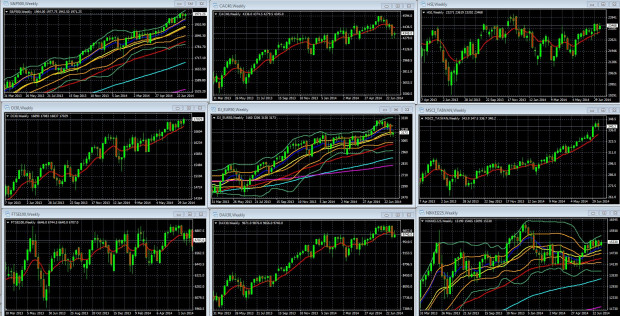
Weekly Charts Of Large Cap Global Indexes  March 31 2013 To Present, With 10 Week/200 Day EMA In Red: LEFT COLUMN TOP TO BOTTOM: S&P 500, DJ 30, FTSE 100, MIDDLE: CAC 40, DJ EUR 50, DAX 30, RIGHT: HANG SENG, MSCI TAIWAN, NIKKEI 225
Key For S&P 500, DJ EUR 50, Nikkei 225 Weekly Charts: 10 Week EMA Dark Blue, 20 WEEK EMA Yellow, 50 WEEK EMA Red, 100 WEEK EMA Light Blue, 200 WEEK EMA Violet, DOUBLE BOLLINGER BANDS: Normal 2 Standard Deviations Green, 1 Standard Deviation Orange.
Source: MetaQuotes Software Corp, www.fxempire.com, www.thesensibleguidetoforex.com
01 Jul. 19 22.06
Key Take-Aways Weekly Chart
The short version: Global risk appetite per our sample of leading US, European, and Asian indexes is mixed. The big down move of the week came Thursday following news of the Malaysian passenger jet shot down over Ukraine by Russian-backed separatists, reflecting fleeting fears that there might actually be sanctions coming that materially affect business as usual. This was followed by a rebound Friday, as these fears apparently faded for now.
The US and Asian indexes continue  their slow grind higher and remain in their double Bollinger® band buy zone, suggesting more upside ahead in the intermediate term. The same fundamentals that have supported the rally since mid-2012 (low rates, no perceived market threats), so the big fundamental picture supports the technical outlook.
