The good news is:
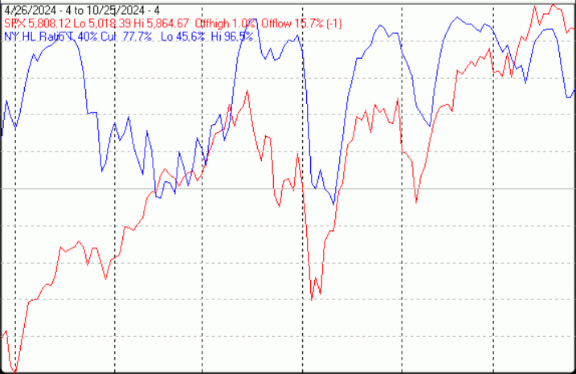
The NegativesThe first chart covers the last 6 months showing the S&P 500 (SPX) in red and a 10% trend (19 day EMA) of NYSE new highs (NY NH) in green. Dashed vertical lines have been drawn on the 1st trading day of each month. NY NH resumed its decline last week.
SeasonalityNext week includes the last 4 trading days of October and the 1st trading day of November during the 4th year of the Presidential Cycle. The tables below show the daily change, on a percentage basis for that period. OTC data covers the period from 1963 to 2023 while SPX data runs from 1928 to 2023. There are summaries for both the 4th year of the Presidential Cycle and all years combined. Average returns for the coming week have been positive by all measures. Report for the last 4 days of October and the first 1 day of November.The number following the year represents its position in the Presidential Cycle.The number following the daily return represents the day of the week;1 = Monday, 2 = Tuesday etc. OTC Presidential Year 4 (PY4) Day4 Day3 Day2 Day1 Day1 Totals 1964-4 -0.07% 2 0.11% 3 -0.11% 4 0.14% 5 0.14% 1 0.21% 1968-4 -0.76% 5 -0.32% 1 -0.75% 2 -0.68% 4 -0.10% 5 -2.61% 1972-4 0.37% 4 0.12% 5 -0.05% 1 0.60% 2 1.04% 3 2.08% 1976-4 0.06% 2 0.22% 3 0.26% 4 0.56% 5 0.64% 1 1.73% 1980-4 -0.30% 2 0.38% 3 -1.02% 4 0.14% 5 0.19% 1 -0.61% Avg -0.14% 0.10% -0.34% 0.15% 0.38% 0.16% 1984-4 -0.65% 5 -0.36% 1 0.39% 2 -0.17% 3 0.38% 4 -0.41% 1988-4 -0.24% 3 -0.89% 4 0.27% 5 -0.09% 1 -0.03% 2 -0.98% 1992-4 -0.33% 2 0.74% 3 0.74% 4 -0.11% 5 0.40% 1 1.44% 1996-4 -0.55% 1 -1.05% 2 0.26% 3 1.27% 4 0.02% 5 -0.05% 2000-4 1.32% 4 0.19% 5 -2.65% 1 5.58% 2 -1.07% 3 3.36% Avg -0.09% -0.27% -0.20% 1.30% -0.06% 0.67% 2004-4 0.77% 2 2.14% 3 0.29% 4 -0.04% 5 0.25% 1 3.41% 2008-4 9.53% 2 0.47% 3 2.49% 4 1.32% 5 0.31% 1 14.13% 2012-4 -0.29% 3 0.15% 4 0.06% 5 -0.36% 3 1.44% 4 1.00% 2016-4 -0.63% 3 -0.65% 4 -0.50% 5 -0.02% 1 -0.69% 2 -2.48% 2020-4 0.64% 2 -3.73% 3 1.64% 4 -2.45% 5 0.42% 1 -3.48% Avg 2.00% -0.33% 0.80% -0.31% 0.35% 2.51% OTC summary for PY4 1964 – 2020Averages 0.59% -0.17% 0.09% 0.38% 0.22% 1.12%% Winners 40% 60% 60% 47% 73% 53%MDD 10/30/2020 4.55% — 10/30/2000 2.65% — 11/1/1968 2.59% OTC summary for all years 1963 – 2023Averages 0.12% -0.14% 0.35% 0.37% 0.30% 0.99%% Winners 43% 59% 57% 64% 66% 62%MDD 10/31/1978 8.29% — 10/30/2001 6.09% — 11/1/2011 4.81%
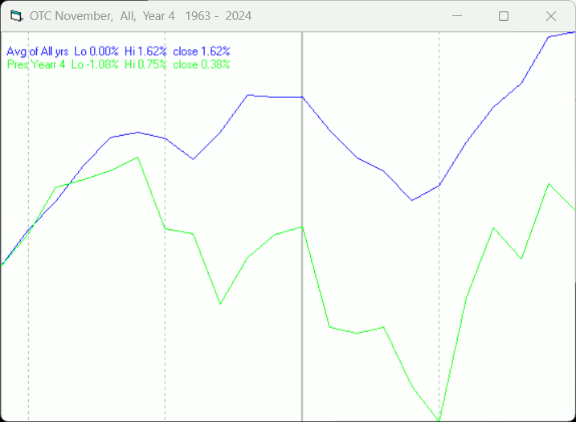
SPX PY4 Day4 Day3 Day2 Day1 Day1 Totals 1928-4 1.02% 6 0.59% 1 -1.09% 2 -0.37% 3 1.43% 4 1.58% 1932-4 0.87% 4 2.01% 5 -1.27% 6 -0.57% 1 -2.87% 2 -1.83% 1936-4 0.06% 3 1.53% 4 0.17% 5 -0.12% 6 -0.23% 1 1.42% 1940-4 -0.37% 1 0.19% 2 0.83% 3 1.47% 4 0.00% 5 2.11% 1944-4 0.16% 5 0.31% 6 -0.23% 1 0.16% 2 0.39% 3 0.78% 1948-4 -0.12% 3 -0.66% 4 0.24% 5 0.24% 6 0.97% 1 0.67% 1952-4 0.17% 2 0.08% 3 0.00% 4 1.53% 5 0.33% 1 2.11% 1956-4 0.92% 5 0.28% 1 -0.06% 2 -1.70% 3 2.06% 4 1.49% 1960-4 1.43% 3 1.07% 4 -0.39% 5 -0.04% 1 1.03% 2 3.11% Avg 0.51% 0.22% -0.09% 0.04% 0.96% 1.63% 1964-4 0.00% 2 -0.36% 3 0.05% 4 0.15% 5 0.38% 1 0.21% 1968-4 0.35% 5 -0.29% 1 -0.58% 2 0.11% 4 -0.34% 5 -0.75% 1972-4 0.24% 4 -0.33% 5 -0.03% 1 0.90% 2 0.98% 3 1.76% 1976-4 0.99% 2 0.69% 3 -0.15% 4 1.27% 5 0.19% 1 3.00% 1980-4 0.13% 2 -0.11% 3 -1.27% 4 0.93% 5 1.23% 1 0.92% Avg 0.34% -0.08% -0.39% 0.67% 0.49% 1.03% 1984-4 -0.61% 5 -0.31% 1 1.25% 2 -0.45% 3 0.84% 4 0.72% 1988-4 -0.35% 3 -1.46% 4 0.45% 5 0.16% 1 0.03% 2 -1.17% 1992-4 0.08% 2 0.39% 3 0.17% 4 -0.52% 5 0.97% 1 1.10% 1996-4 -0.52% 1 0.61% 2 -0.09% 3 0.62% 4 -0.21% 5 0.41% 2000-4 -0.03% 4 1.11% 5 1.38% 1 2.20% 2 -0.57% 3 4.08% Avg -0.29% 0.07% 0.63% 0.40% 0.21% 1.03% 2004-4 1.49% 2 1.29% 3 0.18% 4 0.24% 5 0.03% 1 3.23% 2008-4 10.79% 2 -1.11% 3 2.58% 4 1.54% 5 -0.25% 1 13.55% 2012-4 -0.31% 3 0.30% 4 -0.07% 5 0.03% 3 1.09% 4 1.03% 2016-4 -0.17% 3 -0.30% 4 -0.31% 5 -0.01% 1 -0.68% 2 -1.47% 2020-4 -0.30% 2 -3.53% 3 1.19% 4 -1.21% 5 1.23% 1 -2.62% Avg 2.30% -0.67% 0.71% 0.12% 0.28% 2.74% SPX summary for PY4 1928 – 2020Averages 0.66% 0.08% 0.12% 0.27% 0.33% 1.48%% Winners 58% 58% 46% 63% 67% 79%MDD 11/1/1932 4.65% — 10/30/2020 3.85% — 10/27/1988 1.81% SPX summary for all years 1928 – 2023Averages 0.10% -0.08% 0.43% 0.19% 0.25% 0.87%% Winners 58% 50% 59% 56% 64% 65%MDD 10/29/1929 21.24% — 10/31/1933 6.08% — 11/1/2011 5.20% NovemberSince 1963, over all years, the OTC in November has been up 74% of the time with an average gain of 2.0%. During the 4th year of the Presidential Cycle November has been up 73% time with an average gain of 0.8%. The best November ever for the OTC was 2001 (+14.2%), the worst 2000 (-22.9%).The average month has 21 trading days. The chart below has been calculated by averaging the daily percentage change of the OTC for each of the 1st 11 trading days and each of the last 10. In months when there were more than 21 trading days some of the days in the middle were not counted. In months when there were less than 21 trading days some of the days in the middle of the month were counted twice. Dashed vertical lines have been drawn after the 1st trading day and at 5 trading day intervals after that. The line is solid on the 11th trading day, the dividing point.In the chart below the blue line shows the daily average of the OTC in November over all years since 1963 while the green line shows the average during the 4th year of the Presidential Cycle over the same period.