First time teaching undergrad macro in three years, so I thought time to revise the to account for new issues (compare against ).First, climate change and macro implications. (Click on image to enlarge)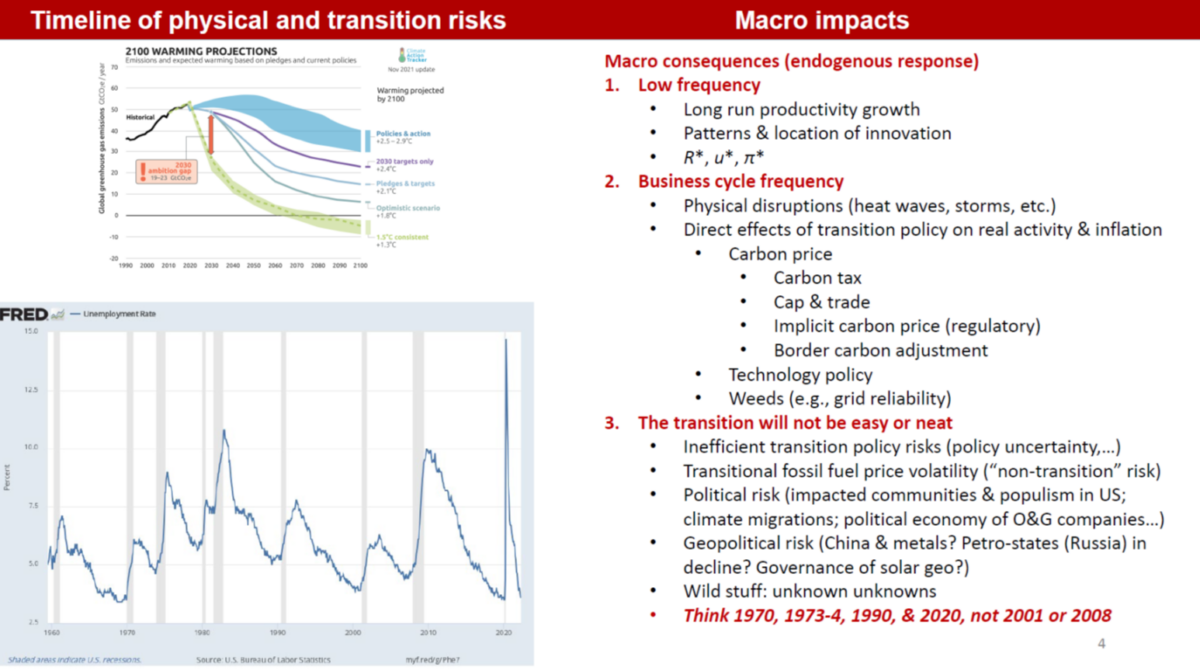 Source: . Will be focusing on climate shocks complicating macro stabilization (consider hurricanes, droughts, heat waves, disaster insurance crises), consequences of reliance on fossil fuels, implications of carbon taxes and cap & trade.Is the Phillips Curve still relevant?
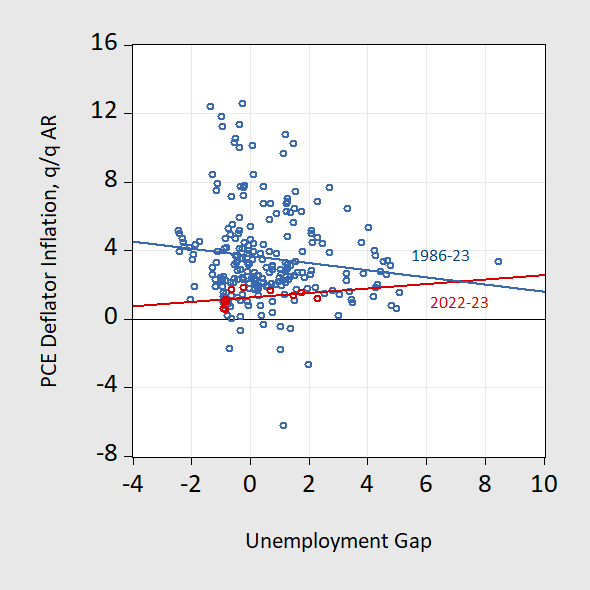 Figure 1: PCE deflator q/q Annualized inflation against unemployment gap, lagged one quarter, 1986-2023Q3. Bivariate regression line for 1986-2023 (blue), for 2021-2023 (red). Unemployment gap calculated as unemployment rate minus noncyclical unemployment rate from CBO. Source: BEA, BLS, CBO via FRED, and author’s calculations.The rapid runup and decline is taken by some as an indictment of the conventional Phillips curve approach. Figure 1 is suggestive. However, even a basic textbook version of the Phillips curve incorporates more than 2 variables…Is it government debt: why have real yields risen?
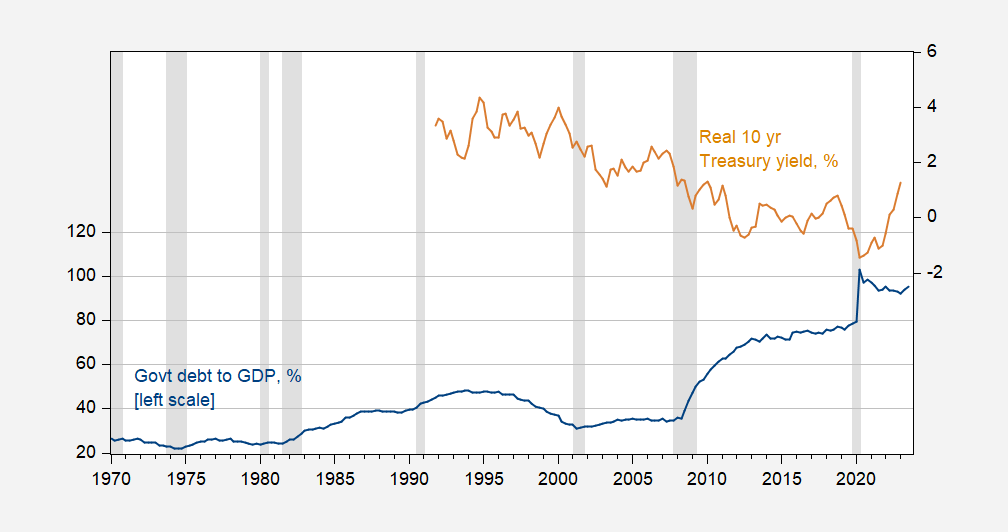 Figure 2: Government debt held by public divided by GDP, % (blue, left scale), and real 10 year Treasury yield, % (tan, right scale). Real yield is nominal 10 year subtracting SPF expected 10 year inflation rate. NBER defined peak-to-trough recession dates shaded gray. Source: Treasury, BEA, via FRED, Philadelphia Fed, NBER, and author’s calculations.The switch from declining debt-to-GDP to rising in 2001, accompanied by falling real yields posed a challenge to conventional wisdom. Did the 2020 jump in debt-to-GDP result in a long-standing break in that association.Will the dollar remain a safe-haven currency (and what does it imply for interest rates)?
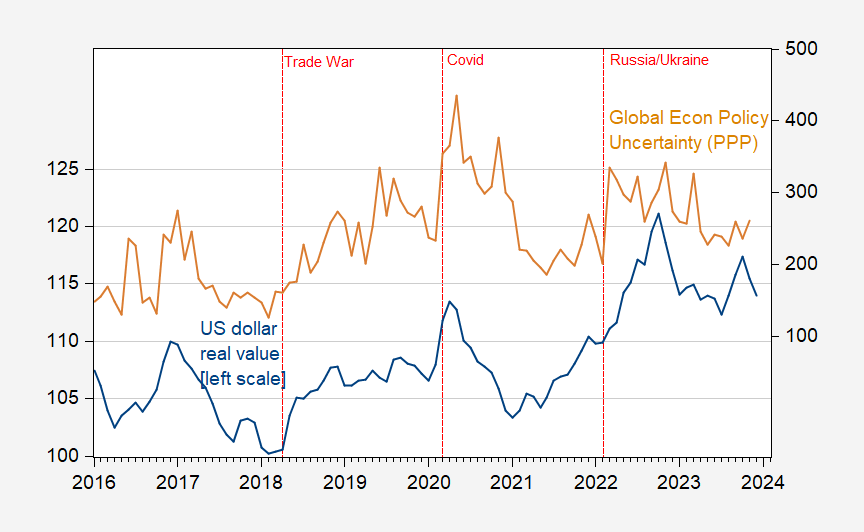 Figure 3: US dollar (broad) real value (blue, left scale), and Global Economic Policy Uncertainty, PPP weighted (tan, right scale). Real exchange rate spliced at 2006M01 – goods weights pre-2006, goods and services weights thereafter. Source: Federal Reserve Board, policyuncertainty.com, and author’s calculations. In times of uncertainty, the dollar rises in value. This is even true when shock emanates from the US (think Covid and bleach; and in September 2008).And what does reserve currency status (related but different from being a safe have currency) imply for continuation of this trend in the US Net International Investment Position?
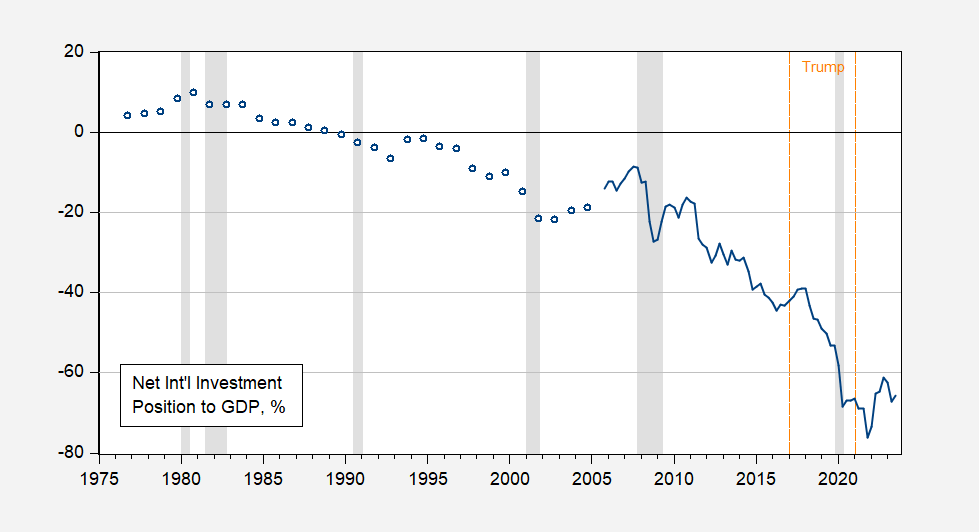 Figure 4: Net international investment of the United States (ex-derivatives) as a share of US GDP, %. NBER defined peak-to-trough recession date shaded gray. Source: BEA, NBER and author’s calculations. Interestingly, the US became increasingly a net debtor (by about 30 ppts of GDP) over the Trump administration. Winning!The textbook for the class is Olivier Blanchard’s Macroeconomics. I know some people will ask (That question is asked by the ). Now you know.More By This Author:EV And Hybrid Sales, Thru December Four Forecasts And Two Nowcasts GDP Trajectory: The View From Wall Street
Teaching Macro 2024

