(T2108 measures the percentage of stocks trading above their respective 40-day moving averages [DMAs]. It helps to identify extremes in market sentiment that are likely to reverse. To learn more about T2108, see my T2108 Resource Page. T2107 measures the percentage of stocks trading above their respective 200DMAs.)
T2108 Status: 53.9%
T2107 Status: 65.4%
VIX Status: 11.9 (up 12.3%, was up as high as 22.8%)
General (Short-term) Trading Call: neutral
Active T2108 periods: Day #237 over 20%, Day #57 over 30%, Day #56 over 40%, Day #54 over 50% (overperiod), Day #1 under 60% (underperiod, ending 4 days over 60%), Day #3 under 70%
Commentary
In my last T2108 Update, I drew 2,080 as the line in the sand dividing my short-term neutral trading call on the S&P 500 (SPY) from flipping to a bearish trading call. On a day of raucous disruptions, the index somehow closed exactly on my line of significance.

The S&P 500 rallied from a sell-off that cracked the 20DMA trend to close right at the launching point for the last breakout.

The Nasdaq gapped down but managed to maintain its on-going uptrend defined by its upper-Bollinger Bands.
This inability to close with a clear signal is quite appropriate for an S&P 500 that has stubbornly refused to provide much in the way of directional trading signals since early December. For a while, I thought the S&P 500 had finally delivered a definitively bearish sell-off. However, buyers stepped into the breach ahead of lunchtime and managed to close out the day with a final burst to 2080.5.
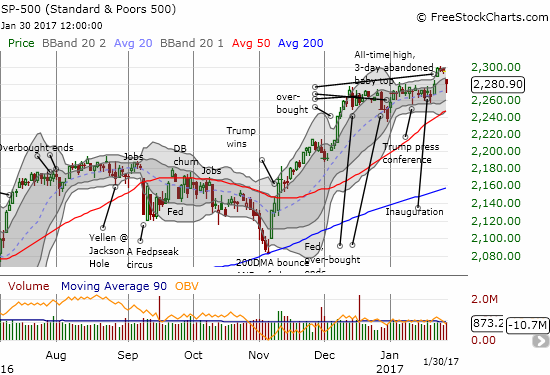
However, I am duly noting a potential “abandoned baby top†in the S&P 500. This pattern occurs when excited buyers gap a stock higher one day and then sellers gap the stock back down the next day. The signal is most powerful when the stock fades from its high in between gaps as the move solidifies the notion of exhausted buyers. For the S&P 500 here, the abandoned baby top pattern played out over 3 days. A close below today’s low of 2,268 will confirm this top – at which point I would likely get aggressively bearish in my short-term trades.
The trading action was even more dramatic for T2108, the percentage of stocks trading above their respective 40-day moving averages (DMAs). At one point, T2108 traded as low as 49.2%, a level last seen two days after the U.S. Presidential election. The recovery back to 53.9% is still a 2 1/2 month low.

T2108 is right back to sagging in what looks like a tantalizing slow unfolding of bearish divergence.
T2108’s 3-day plunge from overbought conditions brings bearish divergence back into sharp relief. I first noted the (surprising) bearish divergence on January 6th. Since then, the S&P 500 has gained a mere 4 points while somehow managing to avoid getting dragged into T2108’s sinkhole, The NASDAQ has stayed even more resilient. Unless the abandoned baby top gets invalidated, the guideposts closing in on the S&P 500 point to a meaningful sell-off in the near future.
din
On significant days like this one I like to look at T2107, the percentage of stocks trading above their respective 200DMAs, as a peak into longer-term health. T2107 dropped back to converged support at its own 50/200DMA combination. Even more importantly, the old post-recession downtrend asserted itself again as a pivot point. More selling from here would confirm a bearish change in events for the longer-term outlook. Otherwise, T2107 is still sitting pretty, healthy, and borderline bullish.
