(T2108 measures the percentage of stocks trading above their respective 40-day moving averages [DMAs]. It helps to identify extremes in market sentiment that are likely to reverse. To learn more about it, see my T2108 Resource Page. You can follow real-time T2108 commentary on twitter using the #T2108 hashtag. T2108-related trades and other trades are occasionally posted on twitter using the #120trade hashtag. T2107 measures the percentage of stocks trading above their respective 200DMAs)
T2108 Status: 70.8% (overbought day #3)
T2107 Status: 66.8%
VIX Status: 11.3
General (Short-term) Trading Call: cautiously bearish
Active T2108 periods: Day #220 over 20%, Day #40 over 30%, Day #39 over 40%, Day #37 over 50%, Day #31 over 60%, Day #3 over 70%
Commentary
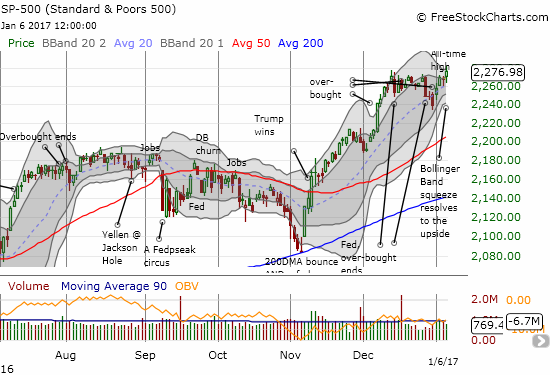
The big resolution of the Bollinger Band (BB) squeeze on the S&P 500 (SPY) came on the heels of the report on U.S. jobs for December.

The S&P 500 broke out of a Bollinger Band (BB) squeeze and printed a new all-time high.

The Nasdaq made an even clearer breakout by stretching above its upper-BB.
I described the importance and mechanics of the BB-squeeze in the January 3rd update and further emphasized its importance in the last T2108 Update. The resolution of the BB-squeeze was to the upside. As a result, per plan, I was supposed to flip the short-term trading call to (cautiously?) bullish. Yet, a very surprising bearish divergence emerged that forced me to apply the brakes. In fact, the divergence is so surprising that I have a nagging doubt about its accuracy. My favorite technical indicator, T2108, the percentage of stocks trading above their respective 40-day moving averages (DMAs), fell so sharply on the day that it almost ended the current overbought period with a 70.8% close.

T2108 almost fell below the 70% threshold for overbought conditions.
So instead of planning for a change in trading strategy, I spent some time for this post trying to identify the source(s) of this bearish divergence. The bottom line: there must have been a good number of stocks sitting at the edge of their 40DMAs, especially among retail stocks and small caps. If so, then it makes sense to take a cautious approach to interpreting moves in and out of overbought conditions in the absence of definitive and convincing supporting signals.
I first looked at the split between the extremes of the low volatility and high beta components of the S&P 500. PowerShares S&P 500 Low Volatility ETF (SPLV) was essentially flat on the day. PowerShares S&P 500 High Beta ETF (SPHB) was also essentially flat. Both indices gained 0.2% which was below the S&P 500’s 0.4% gain on the day. Yet, since neither index fell, I cannot use them to explain the bearish divergence. The charts below indicate that neither index can help explain the S&P 500’s breakout to new all-time highs either. As a reminder, SPLV consists of the 100 stocks from the S&P 500 with the lowest realized volatility over the past 12 months. SPHB consists of the 100 stocks from the S&P 500 with the highest beta over the past 12 months.
