Solana chart analysisThe price of Solana continues its recovery, climbing above the $100.00 level yesterday. Today, we are looking at a continuation with the formation of a new high at the $104.43 level. Solana could soon make a move above $105.00. The EMA200 moving average has been supporting us since last Friday. Potential higher targets are $106.00 and $108.00 levels.For a bearish scenario, although it is not in sight, we need a pullback of the Solana price below the $100.00 level. That would be the first sign that Solana is faltering and there is an increase in . In the following, we would watch the price drop and look for support at lower levels. Potential lower targets are $98.00 and $96.00 levels. The EMA200 moving average is in the zone around the $94.00 level.(Click on image to enlarge)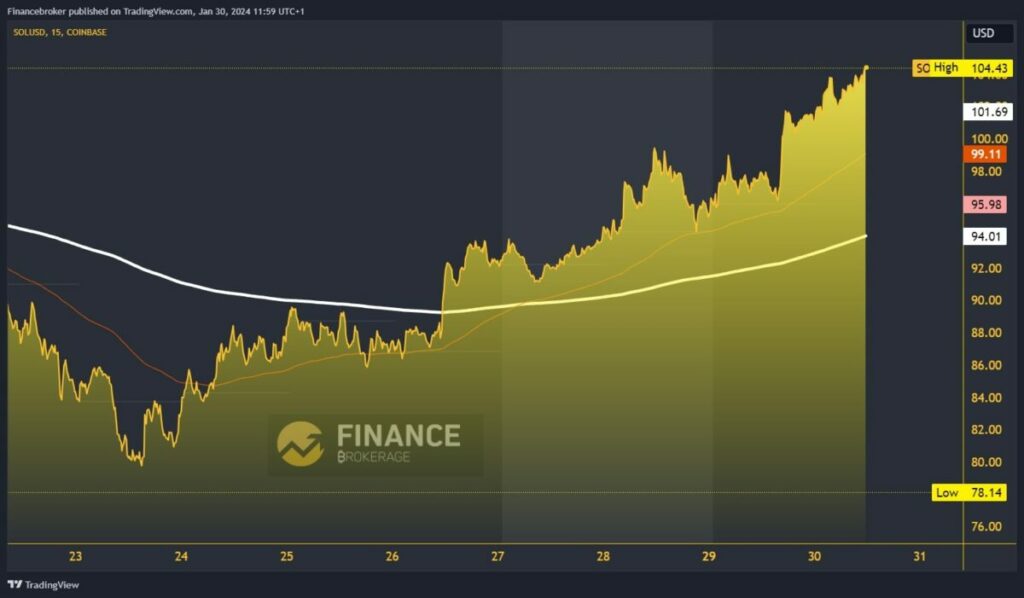 Cardano chart analysisOver the weekend, Cardano’s price successfully crossed the EMA200 moving average barrier. We saw a rise to the 0.500 level and had enough room for consolidation to get support in the EMA200. That proved to be true yesterday, as in the afternoon, we saw a strong bullish consolidation and a jump in the price of Cardano to the 0.536 level.This week’s low was formed there, and the price retreated slightly to the 0.530 level. Potential higher targets are 0.540 and 0.545 levels. We need a price pullback below the 0.525 level for a bearish option. In this way, bearish momentum would increase, and Cardano would have to retreat. Potential lower targets are 0.520 and 0.510 levels.(Click on image to enlarge)
 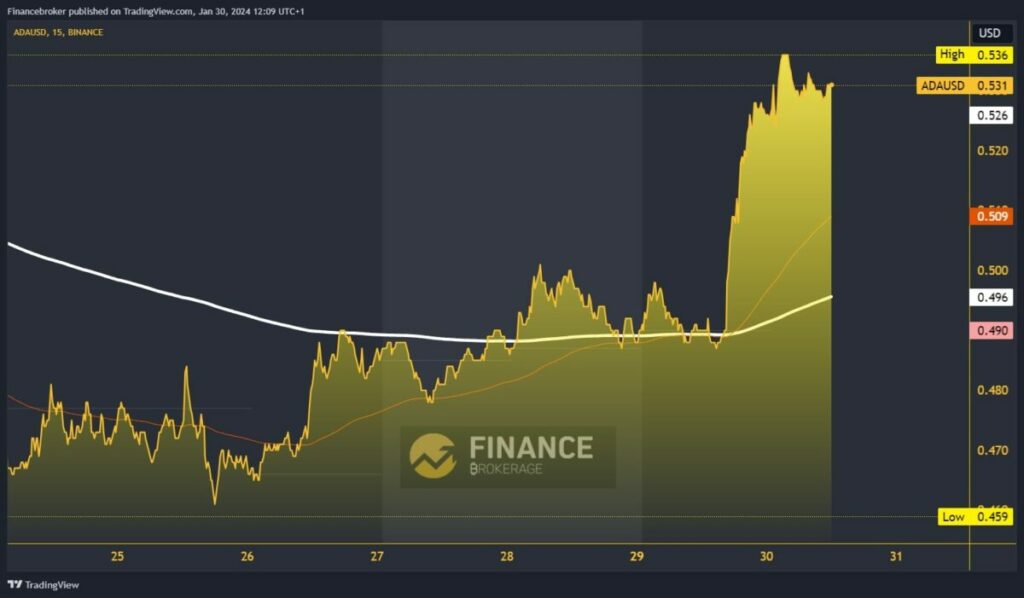 More By This Author:Dogecoin And Shiba Inu: Dogecoin Made A Jump To 0.08300 Bitcoin And Ethereum: Could Bitcoin Rise To The $44000 Level Assessing U.S. Economic Data And The Dollar’s Stability
Solana And Cardano: Cardano Is Back Above The 0.500 Level

