Rather than a Great Rotation from bonds into equities, the rotation instead has been from growth into value. Among the ten U.S. business sectors, uber-defensive sector Utilities is still the clear leader year-to-date, up more than +10%, followed by Energy and Healthcare. Healthcare and Materials were the leaders last week. Consumer Services/Discretionary remains the clear laggard YTD. Moreover, rather than bond prices falling, the 10-year Treasury yield has fallen even further to 2.52%, further indicating a flight to safety.
Of the 470 companies from the S&P 500 that have reported so far, nearly 70% have beaten estimates and 10% have met estimates. Defensive sectors Utilities and Telecom have shown the strongest Q1 earnings growth.
Although the strong U.S. economic fundamentals theoretically should be pushing interest rates up, macro and technical drivers have prevented it. Of course, this is good news and the best of both worlds, as low interest rates (without massive stimulus programs) and improving fundamentals bode well for economic growth and corporate earnings growth — as well as stock prices.
The CBOE Market Volatility Index (VIX), a.k.a. fear gauge, closed last week at 12.44. It continues to creep downward, and remains firmly below the 15 threshold, indicating investor complacency about risk in their stock holdings.
ConvergEx reports that average sector correlations for the 10 business sectors of the S&P 500 have been averaging 79% recently, which is much lower than the 95% correlations displayed during the height of the risk-on/risk-off days of the past few years. Top-performing Utilities is a low 21%, while emerging markets clocks in at just 38%.
It seems like an opportune time for Sabrient to launch this year’s Forward Looking Value portfolio next month.
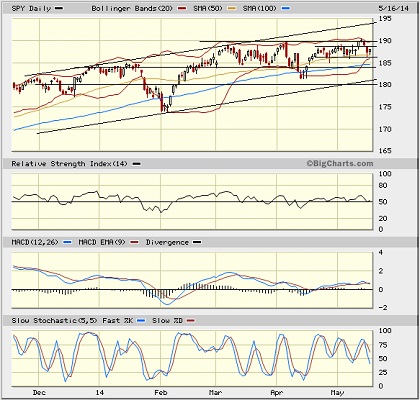
SPY chart review:
The SPDR S&P 500 Trust (SPY) closed Friday at 188.05, which is right about where it closed the previous week, and the week before that. Overhead resistance at 190 proved too strong, and price remains smack dab in the middle of the long-standing rising bullish channel. After briefly showing a desire to break out and display a triple-top buy signal, it turned out to be a false breakout. SPY has now returned back to its neutral sideways channel between roughly 187 and 189. Oscillators RSI, MACD, and Slow Stochastic remain in neutral, still giving no indication of direction. However, Bollinger Bands have suddenly pinched together, which generally indicates that a strong directional move is imminent.

There is still a gap up from April 16 around 184 that has not been filled and continues to act as a magnet. Strong support continues to be provided by the 50-day simple moving average, which now coincides with the lower Bollinger Band. After that is the 100-day SMA, followed by gap support at 184. Below that is the bottom of the long-standing uptrend (currently near 181), followed by round-number support at 180, and then the 200-day SMA (near 178).
