This article examines the sector performance of the U.S. stock market during the “Trump Rally.†Sector performance over the past six months suggests the market’s gains may not be sustainable, as market leadership has been confined mainly to sectors typically associated with a “risk-off†attitude on the part of investors.
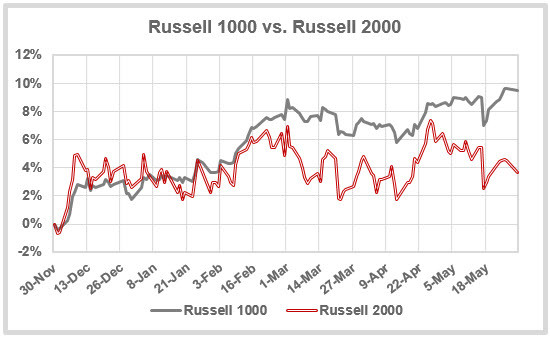
Examining the performance of the stock market broken down by sectors can yield insights into the sustainability of the current market trend. Since November 2016, markets have been buoyed by the “Trump Rally,†in expectation of widespread deregulation and other market-friendly policies. The first chart below depicts the Russell 1000 (largest 1000 stocks in the U.S. by market capitalization) vs. the Russell 2000 (next 2000 largest stocks, representing the mid- and small-cap space). When small-cap stocks lead large cap stocks during a bull market phase it’s usually a positive indicator for the sustainability of the rally, suggesting that investors are comfortable taking more risk (as small-cap stocks are generally riskier). When large-cap stocks lead during a bull phase, the implication is that investors are more cautious about the sustainability of the market’s uptrend.

Â
The graph shows that small- and large-cap stocks participated equally in the Trump rally from November through February (up 7% and 8%, respectively). From March through May, however, small-cap stocks have declined by about 2%, with large-cap stocks extending their gains by a modest 1%. Clearly, almost all the gains from the Trump rally occurred during the first 3 months following the inauguration, with the market taking more of a “wait and see†attitude since then.
The next graph below depicts the top 5 performing sectors in the S&P 500 index over the same time period (I still live in a 10 sector world, never having bought into S&P’s decision that real estate is a market sector — for me, real estate remains an asset class — sorry, S&P). Another way investors gauge the sustainability of a market rally is by which sectors are displaying the most leadership. When “risk on†sectors like Financial, Industrial, Technology, Energy, Materials and Consumer Discretionary stocks are leading the charge, it usually indicates high positive conviction on the part of investors. On the other hand, when more “risk off†sectors like Utilities, Consumer Staples and Health Care lead the way, it usually indicates dampened enthusiasm on the part of investors, who are bidding up the prices of these stocks more out of a “flight to safety†mentality.
