We see nice bounce from the recent 1830 level but a move to the upside can be temporary as we see a corrective personality on the lower time frames. An ideal correction in wave B would reach a top at 2020-2040 in the next few days from where prices could fall back to the lows, deeper within the ongoing corrective red wave IV).
S&P500, Daily

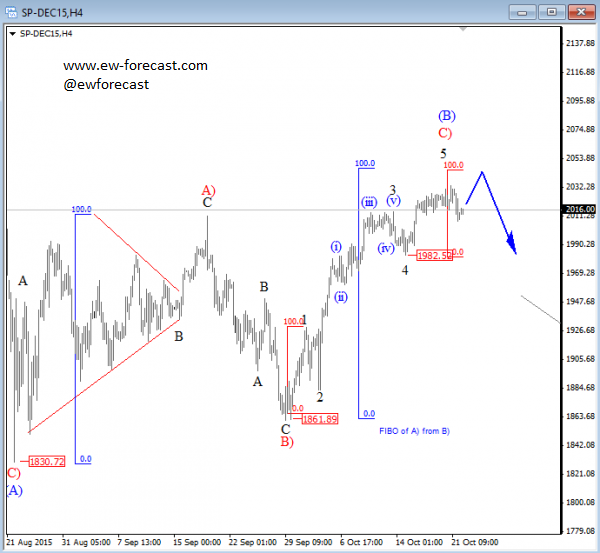
On the 4h chart, S&P500 is back at the highs, so it seems like wave (C) of the flat in wave (B) is still in play towards 100% projection level of wave (C=A) which comes in around 2050. In that zone we also see that black sub-wave 5 will be equal to wave 1, so it’s seems like an ideal area for a reversal down next week.
S&P500, 4h

A Flat is a three-wave pattern labeled A-B-C that generally moves sideways. It is corrective, counter-trend and is a very common Elliott pattern.
Basic Flat Pattern:


