The S&P 500 is up north of 27 percent year-to-date – the second consecutive year of gains of north of 20 percent. Buybacks and margin debt are cooperating, but several other measures are pointing to extended conditions.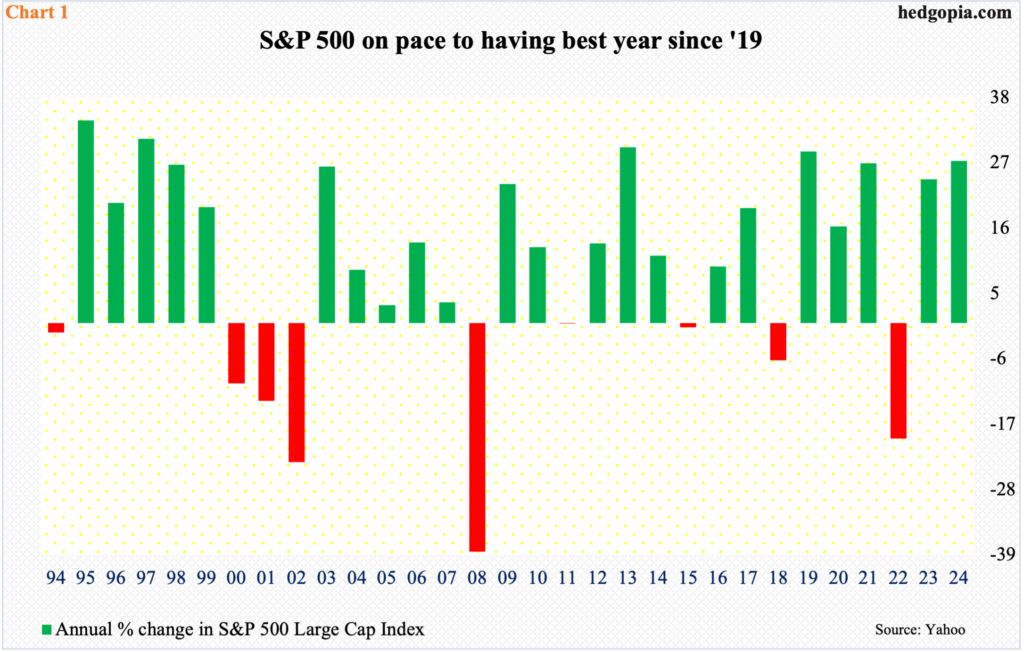 With 10 sessions of trading remaining this year, the S&P 500 is up 27.3 percent – on pace for a best year in five (Chart 1). This comes after last year’s 24.2-percent jump. From the lows of October 2022, the large cap index is up an astounding 74 percent.One has to go back to the late 1990s to witness rallies of north of 20 percent back-to-back. Back then, the streak ended in 1998 after four consecutive years of 20 percent-plus, with ’99 ending just short of 20 percent at 19.5 percent. After that, the S&P 500 suffered three negative years from 2000 through 2002 during which it was cut in half.
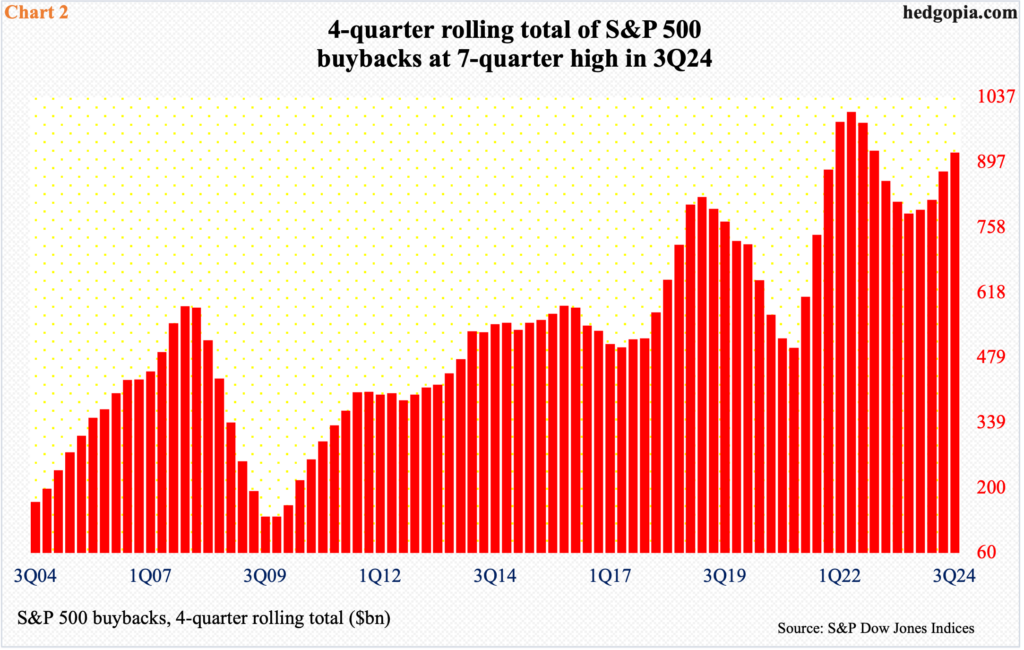 Buybacks have provided a reliable source of tailwind for stocks the last several years. In the September quarter, S&P 500 companies spent $227 billion in buying back their own shares. This set a three-quarter low, rising 16.7 percent from a year ago. The $237 billion these companies spent in the March quarter set an eight-quarter high before softening a tad.On a 12-month basis, buybacks were $918 billion in 3Q24 – a seven-quarter high (Chart 2); the all-time high was set in 2Q22 when $1,005 billion was spent.
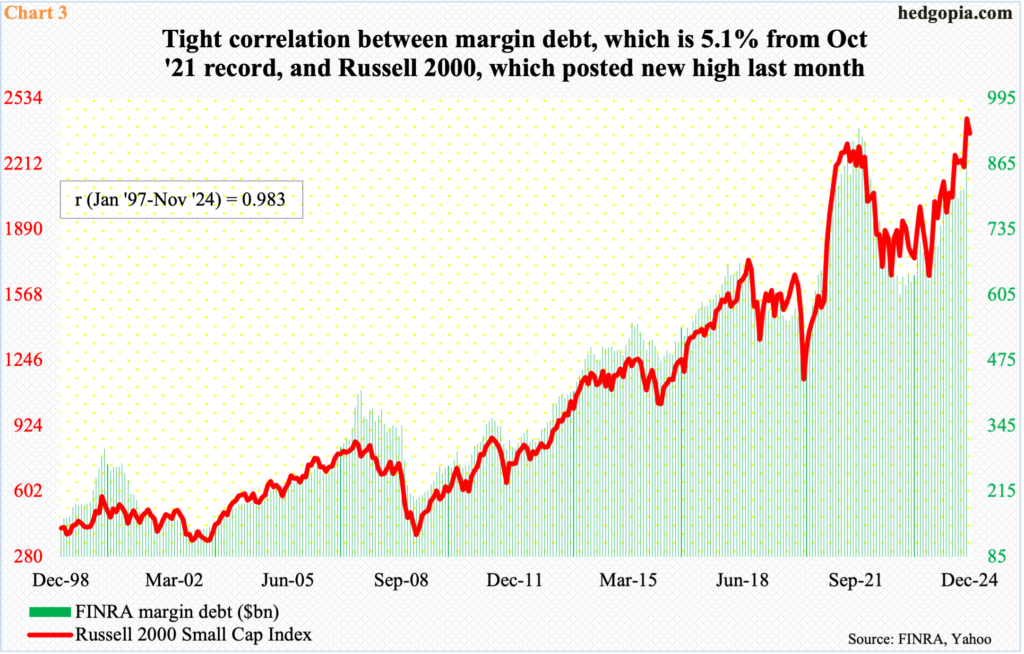 Equities are also drawing support from margin debt, which took a back seat for a while before picking up momentum last month. In November, FINRA margin debt jumped 9.3 percent month-over-month to $891 billion, which is 5.1 percent from the record $936 billion set in October 2021 (Chart 3).Margin debt tends to have a tight correlation with small-cap stocks. The Russell 2000, which peaked in November 2021, waited three long years before surpassing that high last month. Small-caps are treated as a way to measure investor willingness to take on risk. On that score, post-November 5th presidential election and Donald Trump’s win, the Russell 2000 has come alive. As has willingness to take on leverage.
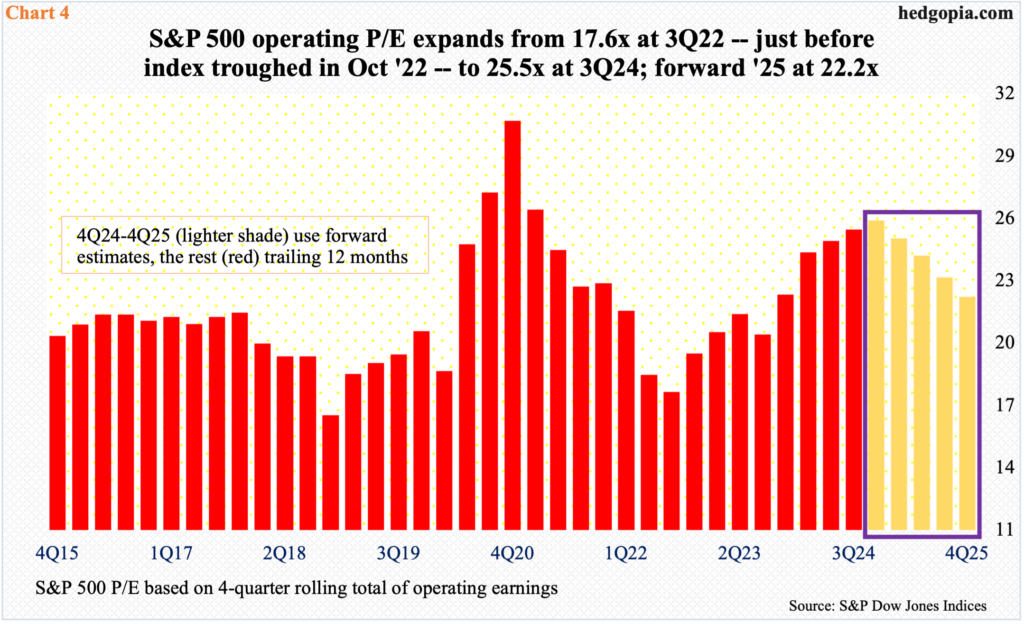 This has pushed up multiples. The sell-side has S&P 500 companies bringing home $233.63 in operating earnings this year and $272.43 next. This compares with $213.52 they rang up in 2023. These analysts are notorious for starting out optimistic and then bring out the scissors as the year progresses. For 2024, estimates in March last year were $246.31; 2025 estimates similarly were $277.86 this July.Post-election, which has rekindled economic hopes, the revision trend is slightly down to flattish. Even assuming these companies meet 2025 estimates, the S&P 500 currently trades at a forward price-to-earnings multiple of 22.2x, which is not cheap by any stretch of the imagination. Using the actual four-quarter total, the multiple was 25.5x at the end of September (Chart 4).
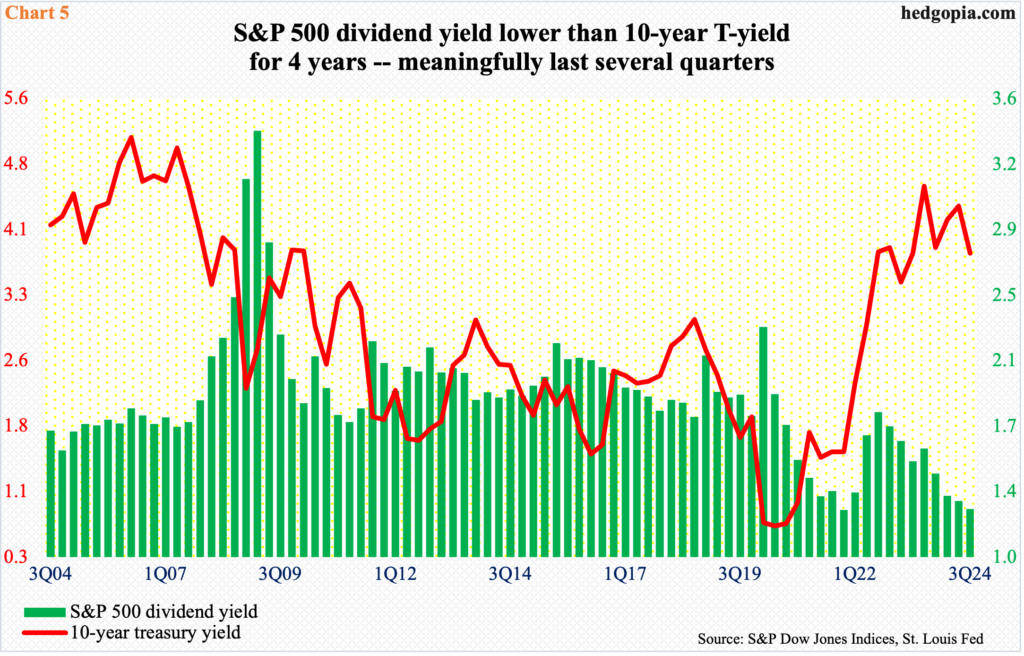 The picture looks similarly pricey comparing the S&P 500 dividend yield with the 10-year treasury yield (Chart 5).At the end of the September quarter, the S&P 500 yielded 1.27 percent, matching the low from 4Q21. Yield has not been this low going back to 4Q00.In contrast, after remaining sub-one percent for several quarters, the 10-year treasury yield began to rise in 2021, as the long end of the yield curve anticipated a rise in the fed funds rate, which went from a range of zero to 25 basis points in March 2022 to between 525 basis points and 550 basis points by July last year. The benchmark rates are currently between 450 basis points and 475 basis points, with a 25-basis-point cut tomorrow all but certain.The 10-year yield rose as high as five percent in October last year before coming under pressure to bottom at 3.6 percent this September, with the quarter ending at 3.81 percent. These notes are currently yielding 4.4 percent, which strictly from the yield perspective offer more than 300 basis points more than what the S&P is yielding.
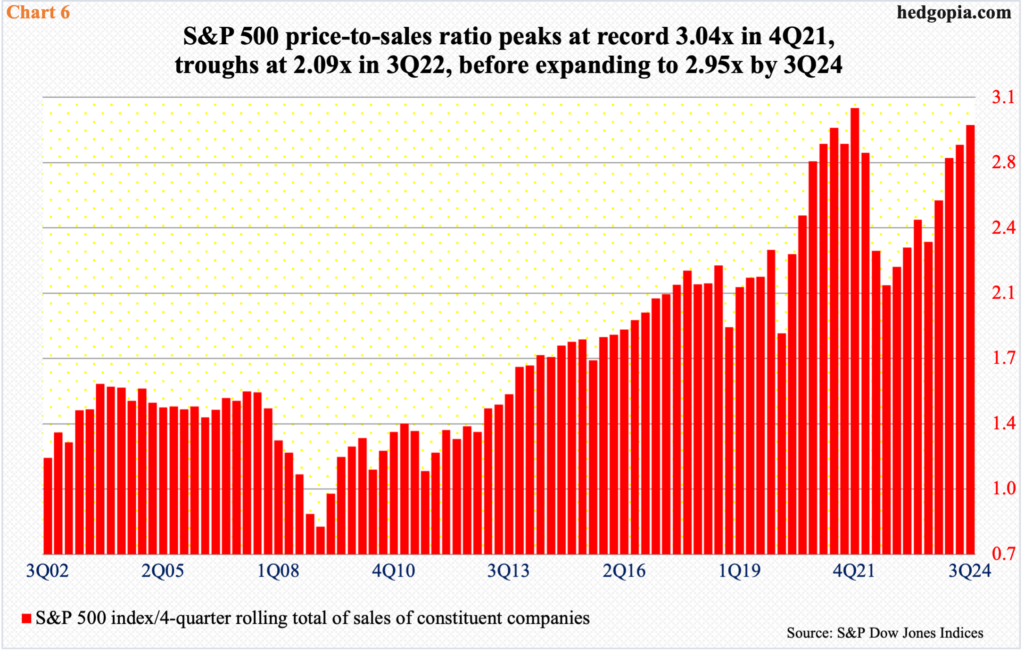 The price-to-sales ratio draws a similarly lopsided picture. At the end of the September quarter, the S&P 500 traded at a ratio of 2.95, which is the second highest ever (Chart 6). In 4Q21, a record 3.04 was set. Subsequently, it bottomed at 2.09 in 3Q22, before rising on a sustained basis. A new high could very well be in the cards in the current quarter.
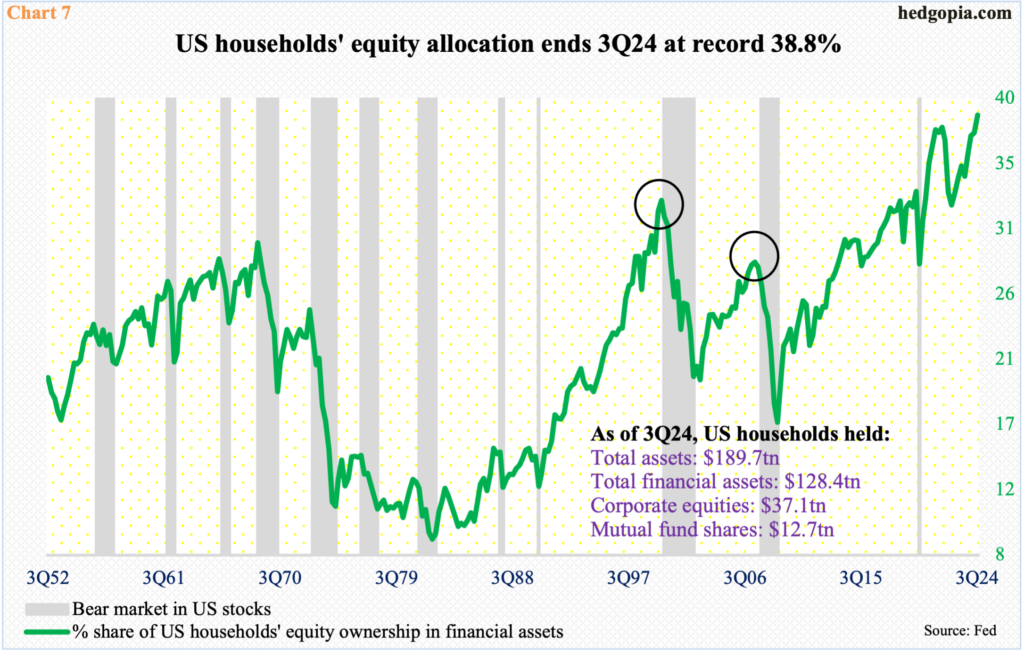 Speaking of a new high, households’ equity allocation just set a record in the September quarter. At 38.8 percent, it comfortably surpassed the prior high of 37.9 percent from 4Q21 (Chart 7). Needless to say, the metric currently stands much higher than the dot-com-bubble and great-financial-crisis highs.It is not even worth conjecturing how, and when, all this ends. Plenty of good news is already in the price. Not a single strategist expects a down year next year, with the most optimists giving the S&P 500 a target of north of 7000. This much is certain. The already stretched valuation/sentiment measures do not necessarily have to begin unwinding, as overbought conditions do not guarantee immediate reversals. These conditions do, however, create opportunities for contrarians.More By This Author:CoT And The Future Thru Futures: What We’re Gleaning From The Latest ReportElevated Investor Sentiment And Volatility/Options Dynamics Probably Favor ContrariansThe Future Thru Futures: What We’re Gleaning From The Latest CoT Report
S&P 500 On Pace For Back-To-Back 20%-Plus Gains

