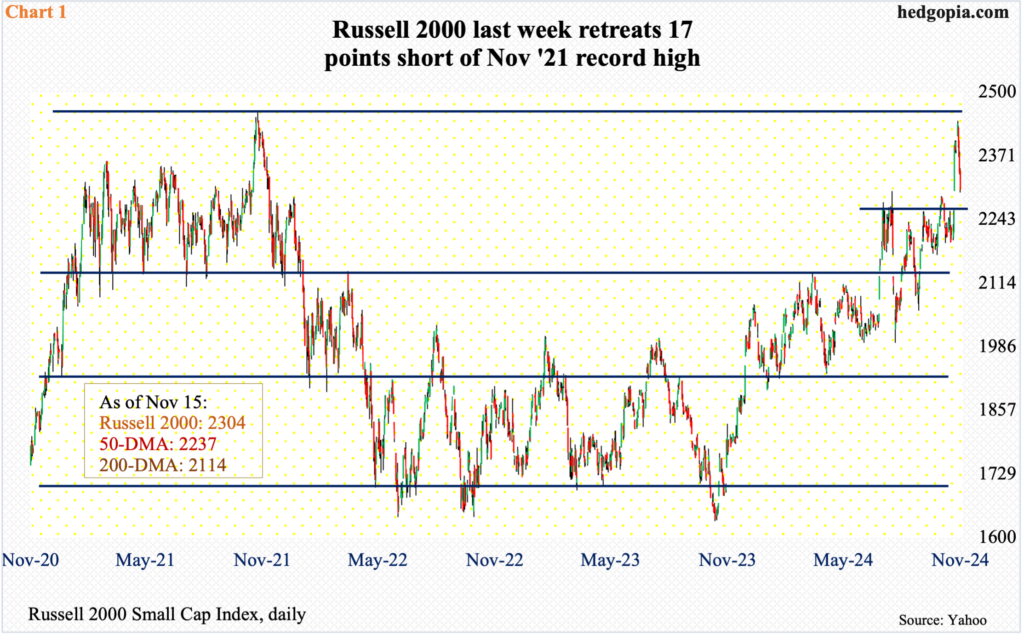
The Russell 2000 just made a three-year round trip but fell slightly short of posting a new high. The economy continues to perform well – a plus – but long rates have diverged with short rates, which cannot be a positive. In the meantime, earnings estimates for S&P 600 companies are now on pace to drop this year. Small-caps assertively led in US equities’ celebration of president-elect Donald Trump’s victory. During the week of election held on the 5th, the Russell 2000 shot up 8.6 percent. It then dropped four percent last week, but not before extending the prior week’s advance.Last Monday, the small cap index ticked 2442 intraday, which was merely 17 points from the all-time high of 2459 posted in November 2021 (Chart 1). But, as the week progressed, selling picked up steam. By the end of the week, it closed at 2304, falling in four out of five sessions.From small-cap bulls’ perspective, the good thing is that the index remains above horizontal support at 2260s going back to mid-July. This hurdle was taken out on the 6th in a gap-up session. Nonetheless, their inability to soak up all the offers at such a crucial spot does not speak very highly of the post-election surge.For now, 2260s is the one to watch.
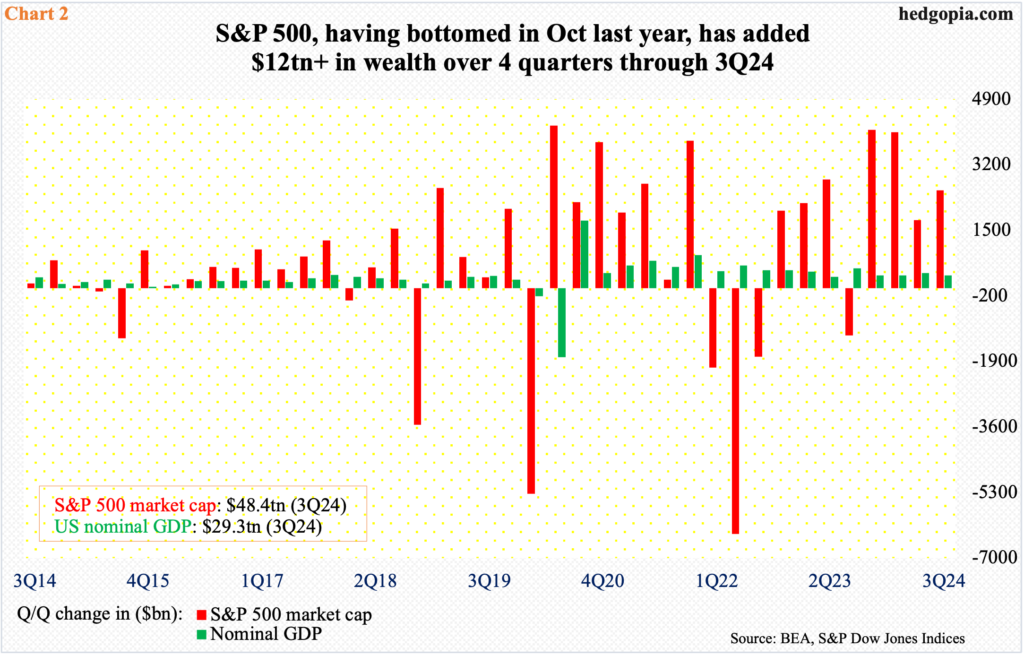
 The hot and cold action in the Russell 2000 in the past couple of weeks comes at a time when most macro data continue to come in hotter than expected. Last week, both consumer and wholesale inflation for October came in stronger than the consensus, as did retail sales for the same month.The economy continues to surprise with its strength and resiliency. It is probable the wealth effect is at work here, although this is not the only variable. The S&P 500 bottomed in October last year, and its market cap has gone up north of $12 trillion over the last four quarters (Chart 2), ending the September quarter at $48+ trillion. In the current quarter, the large cap index is up another 1.9 percent and was up as much as 4.4 percent at last Monday’s high.
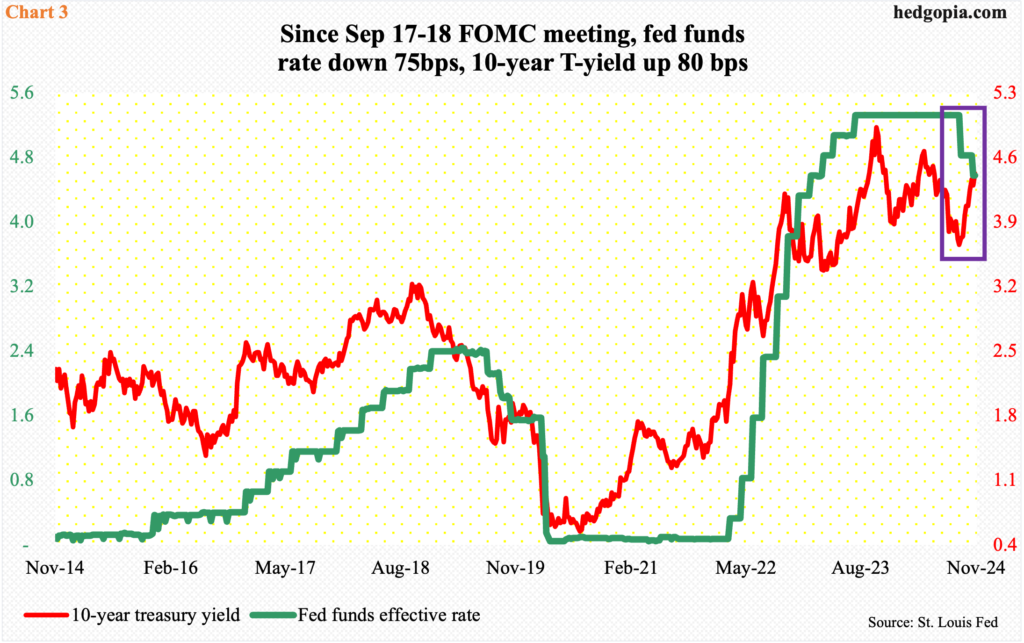
 Ordinarily, small-caps tend to flourish in good times economically as they are mostly domestically focused – unlike large-caps which also have overseas exposure. So, if past is prologue, small-caps should be performing better, particularly at a time when the Federal Reserve has reduced the fed funds rate by 75 basis points in the past two months to a range of 450 basis points to 475 basis points.Oddly, however, rates on the long end of the yield curve are not taking a cue from short rates. Since the September 17-18 FOMC meeting, when the fed funds rate was lowered by 50 basis points, the 10-year treasury yield has gone up by 80 basis points, with the latter tagging 3.6 percent intraday and closing at 3.64 percent on the 17th and closing last Friday at 4.43 percent with a session high of 4.51 percent.Rates are in divergence. Depending on companies’ loan exposure, rates are acting as a tailwind for some and headwind for others.
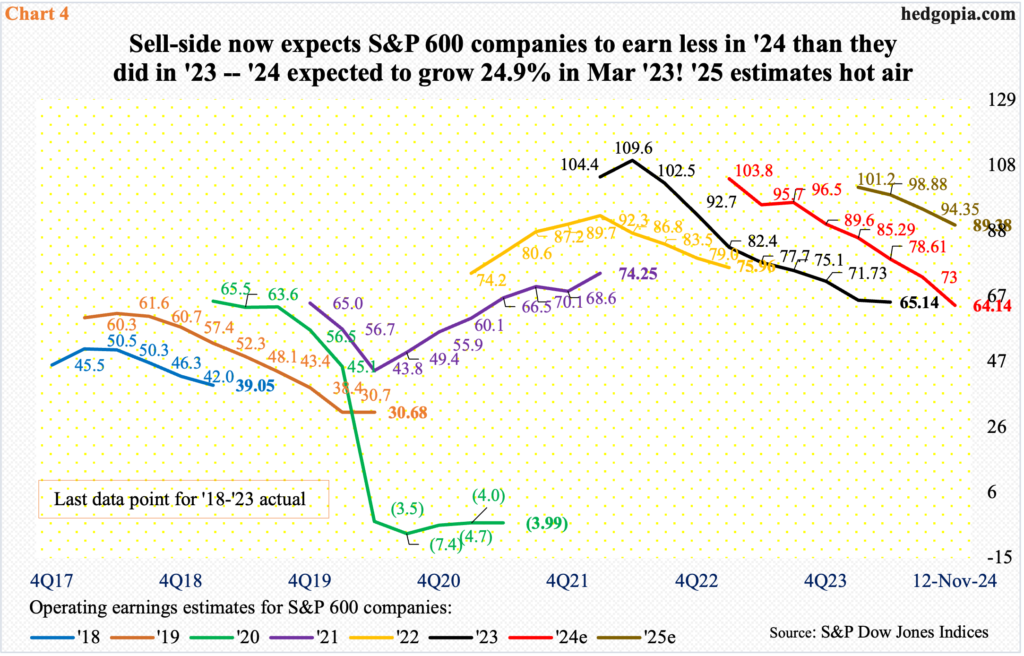
 Amidst all this, 2024 earnings estimates for S&P 600 companies just about crashed last week. As of last Tuesday, blended operating earnings estimates tumbled $5.16 week-over-week to $64.14, which is now lower than last year’s $65.15 (Chart 4).In 2023, earnings declined 14.2 percent. Now, it looks like earnings are on course for a back-to-back drop. The irony is that the sell-side in March last year was penciling in $105.68 for this year. These analysts have a habit of starting out optimistic and then bring out the scissors as the year goes on. Some scissors they are turning out to be.With this as a background, it gets difficult to trust 2025 numbers, which once again are on the high side. The sell-side currently expects $89.38 for next year. Even here, they are being revised lower, as in May this year 2025 estimates were $102.88.This complicates things for even an ardent small-cap bull. If next year’s revision trend follows on the same path as 2024 or 2023, numbers are headed a lot lower. Psychologically, this probably makes it harder to buy close to all-time highs. More By This Author:
Russell 2000 Retreats After Coming Ever So Close To Nov ’21 Record

