The expected risk premium for the Global Market Index (GMI) increased in the February estimate — the first rise in six months. GMI — an unmanaged, market-value weighted mix of the major asset classes — is projected to earn an annualized 4.0% over the “risk-free†rate for the long term. (For details on the equilibrium-based methodology that’s used to generate the forecasts each month, see the summary below). Today’s updated estimate, which is based on data through the close of last month, jumped 50 basis points from the previous 3.5% projection.
Adjusting for short-term momentum and longer-term mean-reversion factors (defined below) trimmed GMI’s current ex ante risk premium to an annualized 3.7%, but this estimate is also an improvement over the previous month’s 3.4% projection.
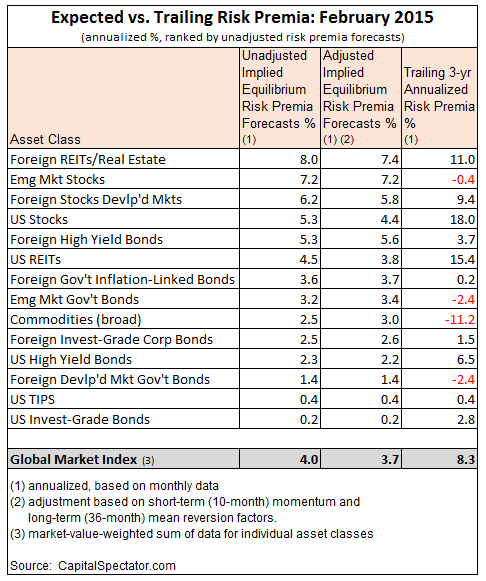
Despite the latest increase, GMI’s current risk premia forecast remains substantially below the index’s realized performance in recent history. GMI’s risk premium is an annualized 8.3% for the trailing 3-year period through February 2015.
Here’s a summary of the current risk premia projections for GMI and the major asset classes that comprise the benchamrk:

Here’s a recap of how GMI’s risk premia forecasts have evolved in recent months:

Turning to what the markets actually delivered, here’s a chart of rolling three-year annualized risk premia for GMI, US stocks (Russell 3000) and US Bonds (Barclays Aggregate Bond Index) through last month.

Finally, here’s a brief summary of the methodology and rationale for the estimates above. The basic idea here is to reverse engineer expected return based on assumptions about risk. Rather than trying to predict returns directly, this approach relies on the somewhat more reliable model of using risk metrics to estimate performance of asset classes. The process is relatively robust in the sense that forecasting risk is slightly easier than projecting return. With the necessary data in hand, we can estimate the implied risk premia using the following inputs:
◠an estimate of GMI’s expected market price of risk, defined as the Sharpe ratio,
which is the ratio of risk premia to volatility (standard deviation).
â— the expected volatility (standard deviation) of each asset
â— the expected correlation for each asset with the overall portfolio (GMI)
