During the last week or two, the market produced some nice price action setups that we discussed here on Forex Crunch. Let’s have a quick look over these signals and see what happened.
Gold Asian Breakout Trap

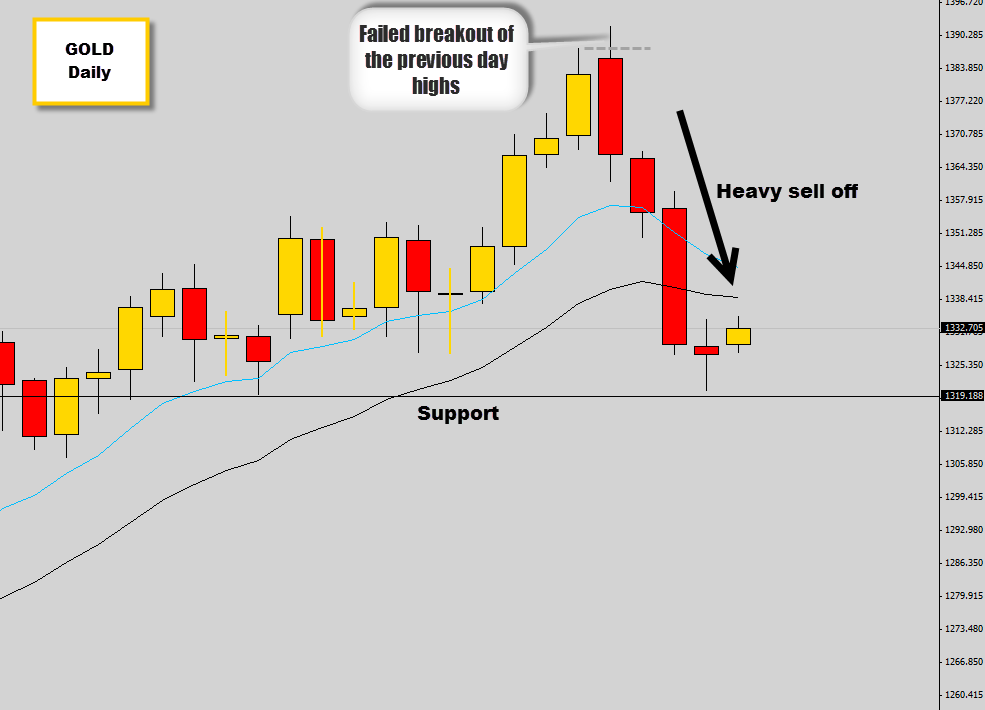
“A breakout occurred during the early asian trading hours which was rejected very quickly, creating a false asia breakout signalâ€
The gold rally has been on a screamer of a bull run, but we all know what goes up must come down at some stage. Now I am not staying this is the end of the uptrend, but the market does need to move down before it can move up again for the simple reasons markets don’t move in straight lines.
Gold has really stretched out into extreme prices. We can tell this because there is a gap between the mean value (20 ema) and price itself. Generally the market can’t maintain itself at these ‘extended prices’ because traders consider this price too expensive. Perfect for a mean reversion setup.
The gold market did breakout during today’s asian session, which didn’t last long as the breakout turned into a fakeout. Asia session fakeouts can give good insight in what to expect in the following london/Nysession. Due to the Asia breakout trap and the bearish price action we are seeing flow off this fakeout, there is a good chance gold is going to start weakening and retracing back to its mean value.
What happened next…

After the failed breakout the gold market sold off quite heavily in the next few trading sessions, offering good return on investment. Gold has stalled now after slamming into support. My bias is now bearish on this chart, but I am expecting a bullish retracement back to the mean value before any further selling takes place.
Watching the mean value for bullish price action sell signals to develop for opportunities to go short with the bearish momentum.
AUDCAD Rejection candle at extreme prices
“The AUDCAD daily chart demonstrated rejection of higher prices, while already extended away from the meanâ€.

The bullish momentum that we’ve got going here on the AUDCAD daily chart fired off a large bullish power candle during Wednesday’s trading session. The aggressive acceleration of price has over extended the market and left a gap between the mean value and price itself. This gap can create good “mean reversion†trade opportunities.
Last session, the market tried to continue moving higher, but the market couldn’t maintain these prices which are considered “expensive†relative to the mean. The move was rejected and close as a bearish rejection candle. The day closed lower than the open price which is a nice finishing touch. A break of the low would be confirm bearish momentum and help confirm that a counter trend mean reversion/correction is taking place
The Result

Unfortunately the market didn’t respond as expected on this one. The bulls here still remained strong and drove prices even higher. I am waiting for a correction back to the mean value where I will consider going long if a bullish price action signal form.
Some might think it’s weird I am posting a losing trade, but losing is part of being a good trader. Not all price action trades are going to work out and that’s nothing to be ashamed about.
This was a countertrend setup and they do have a lower success rate. That’s why it’s best for newbies to stick with trading with the trend, buying low and selling the highs in the direction of the overall trend pressure.
GBPUSD prints large rejection candle on support
“A rejection candle with a large upper tail was printed right on a key support levelâ€

Recently we’ve seen the GBPUSD fall into consolidation and become a sideways market after climbing above a support level. We’re now starting to see some aggressive bearish price action coming off the range top, where a bearish rejection candle formed. The rejection candle did see a nice sell off and now the market is testing the range floor.
Last session the bulls did try to lift off the range support, but the move into higher prices was rejected later on in the New York session. The rejection left quite a large upper tail on the daily candle communicating the scope of the bearish pressure. With such determination, it’s likely the support level won’t hold and we will see the support level break.
Support Breaks As Anticipated

As expected the heavy bearish pressure on the support level did cause the market to break below. The rejection candle was very large and communicated strong bearish presence. The support level did hold for a few days as the market stalled, but the final shake out did occur and we seen an aggressive sell off.
Keeping an eye of for retracements back to the mean value, looking to sell any bearish price action signals that form with the new bearish momentum.
These charts are a good example that you really don’t need to make your trading complicated to be successful at trading. Don’t stress yourself out by bringing in unnecessary variables like complicated indicators, ‘magic’ chart tools, or expert advisors. Simple strategies work better in the markets, that’s why I love trading directly with price action.
Until next time, good luck with your trading


