
Tesla ( – ) kicked off the Q3 reporting cycle for the Magnificent 7 companies in style, with significant gains on the margins front raising hopes that competitive pressures may have started to ease. Tesla’s issues have always been unique, not providing any read-through to the five Mag 7 peers that are coming out with Q3 results this week.This week takes us into the heart of the Q3 earnings season, with more than 800 companies reporting results, including 168 S&P 500 members. Of the Mag 7 members, we have Alphabet ( – ) on Tuesday, October 29th, Meta ( – ) , and Microsoft ( – ) on Wednesday, October 30th, Amazon ( – ) and Apple ( – ) on Thursday, October 31st.The bounce in Tesla shares has more than made up for the market’s disappointment with the Robo taxi announcement. But the stock is still the Mag 7 laggard this year, as the chart below shows.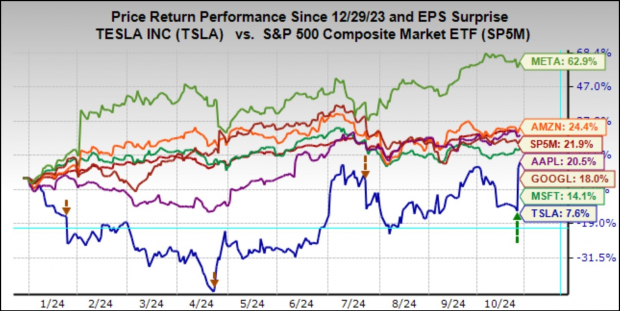 Image Source: Zacks Investment Research
Tesla’s margin gains are particularly notable in this quarterly release, but it is perhaps premature to assume that the margin pressures are now behind them. There is some talk that maybe a bigger proportion of this quarter’s deliveries came from the high-margin Shanghai factory. Part of the gains may also have resulted from production tax credits related to Tesla’s battery production.Should Tesla’s Q3 margin gains prove durable, then we can reasonably expect extrapolation of the same into the coming quarters. The table below shows net margins for the group, with Tesla’s 2024 Q3 net margins of 8.7% up from 5.8% in the preceding period and 7.9% in the year-earlier period.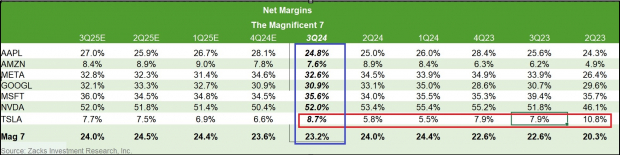 Image Source: Zacks Investment Research
Alphabet shares were down in response to the last earnings report on July 23rd even though the company had handily beaten consensus EPS and revenue estimates. If we look at the stock’s performance since July 22nd, the day before the Q2 earnings release, Alphabet shares are down -9.3%, which compares to a +1.1% gain for the Zacks Tech sector and a +3.9% gain for the S&P 500 index.Given this performance despite strong results, we can reasonably opine that the market will remain unimpressed with this report as well unless management can make a compelling case for its ever-rising AI-centric spending plans. Investors’ worries increased due to management’s comment during the Q2 earnings call that the risk on the capex question was more about under-investing than the alternative.The capex question isn’t restricted to Alphabet alone, as Microsoft, Amazon, and Meta also face the same issue. But the issue is particularly central for Alphabet as many in the market see AI as risking the company’s search monopoly. This likely explains why Alphabet shares have lagged Microsoft and Amazon over the last three months, as the chart below shows.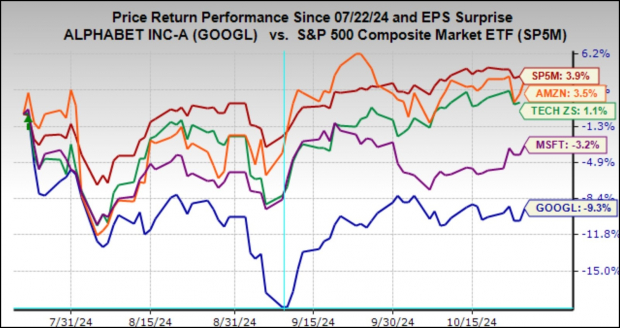 Image Source: Zacks Investment Research
Take a look at the chart below that shows current consensus expectations for the ‘Mag 7’ stocks as a whole for the current and coming periods in the context of what they were able to achieve in the preceding period.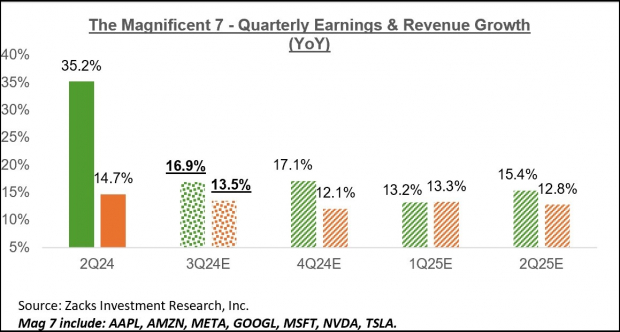 Image Source: Zacks Investment Research
As you can see, the group is expected to bring in +16.9% more earnings in Q3 relative to the same period last year on +13.3% higher revenues.The chart below shows the group’s earnings and revenue growth on an annual basis.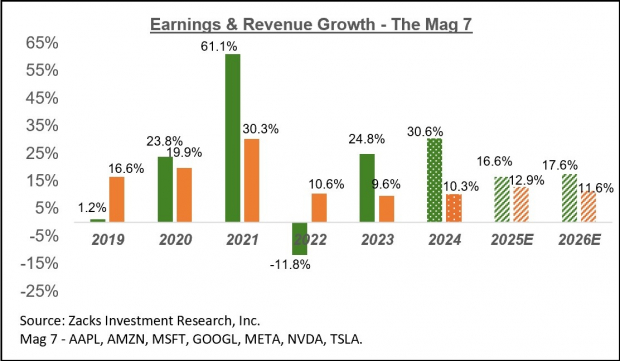 Image Source: Zacks Investment Research
As we all know by now, the group’s phenomenal boost in 2021 partly reflected pulled forward demand from future periods that got primarily adjusted in 2022. The group returned to the ‘regular/normal’ growth model last year, and the trend is expected to continue this year and beyond.
Q3 Earnings Season Scorecard
Through Friday, October 25th, we have seen Q3 results from 182 S&P 500 members, or 36.4% of the index’s total membership. With 168 S&P 500 members on deck to report results this week, we will have seen Q3 results from 70% of the index’s membership.Total earnings for these 182 companies that have reported are down -2.1% from the same period last year on +4.5% higher revenues, with 75.8% of the companies beating EPS estimates and 58.8% beating revenue estimates.The proportion of these 182 index members beating both EPS and revenue estimates is 51.1%.The comparison charts below put the Q3 earnings and revenue growth rates and the EPS and revenue beats percentages in a historical context. The first set of comparison charts show the earnings and revenue growth rates.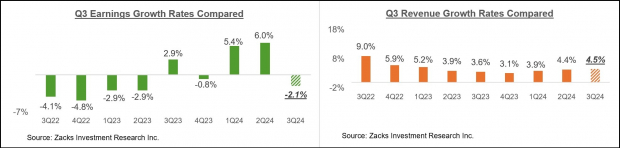 Image Source: Zacks Investment Research
The second set of comparison charts compare the Q3 EPS and revenue beats percentages in a historical context.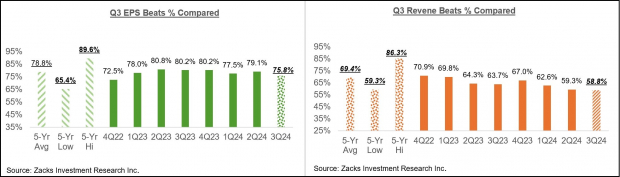 Image Source: Zacks Investment Research
The comparison charts below spotlight the revenue performance and the blended beats percentage for this group of 182 index members.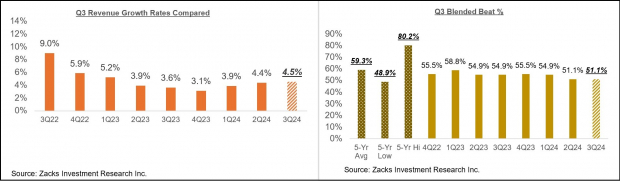 Image Source: Zacks Investment Research
The Earnings Big Picture
Looking at Q3 as a whole, combining the results that have come out with estimates for the still-to-come companies, total earnings for the S&P 500 index are expected to be up +1.5% from the same period last year on +5% higher revenues.The chart below shows the Q3 earnings and revenue growth pace in the context of where growth has been in the preceding four quarters and what is expected in the coming three quarters.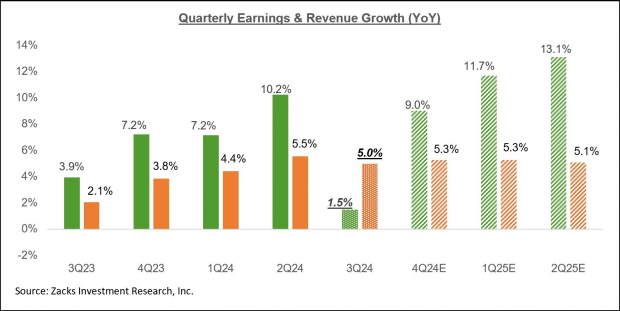 Image Source: Zacks Investment Research
Notwithstanding the modest growth pace in Q3, the aggregate earnings total for the period is very close to the preceding period’s all-time quarterly record, as the chart below shows.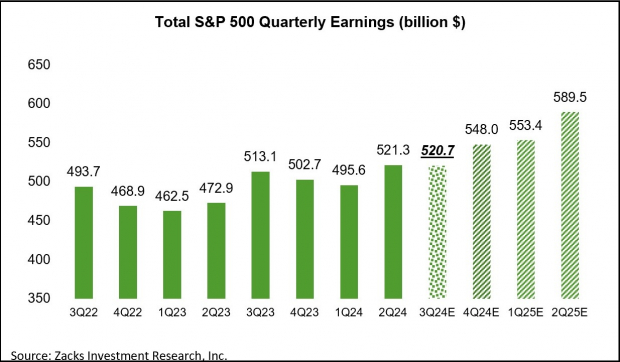 Image Source: Zacks Investment Research
For the last quarter of the year, total S&P 500 earnings are expected to be up +9% from the same period last year on +5.3% higher revenues.Unlike the unusually high magnitude of estimate cuts that we had seen ahead of the start of the Q3 earnings season, estimates for Q4 are holding up a lot better, as the chart below shows.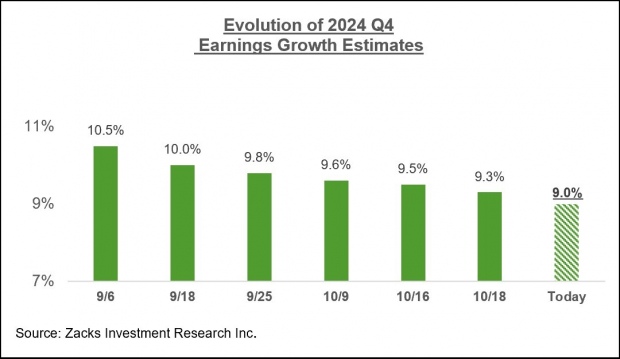 Image Source: Zacks Investment Research
The chart below shows the overall earnings picture on a calendar-year basis, with the +7.3% earnings growth this year followed by double-digit gains in 2025 and 2026.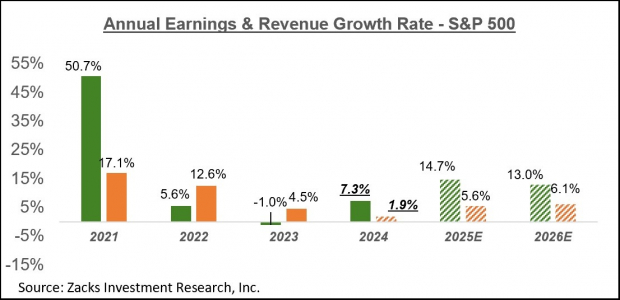 Image Source: Zacks Investment ResearchPlease note that this year’s +7.3% earnings growth improves to +9.2% on an ex-Energy basis.More By This Author:
Previewing Big Tech Earnings

