 Image Source:
PepsiCo () is trading mostly sideways this year between 190 – 150 levels, but it looks like a consolidation within bullish trend. We see it as a bullish ABCDE triangle formation in wave (4) that be coming to an end with final wave E after recent earnings report. So, as soon as bullish triangle fully completes, we may see a bullish continuation for wave (5) towards 200 area. Bullish confirmation is above upper triangle line and 180 area.(Click on image to enlarge)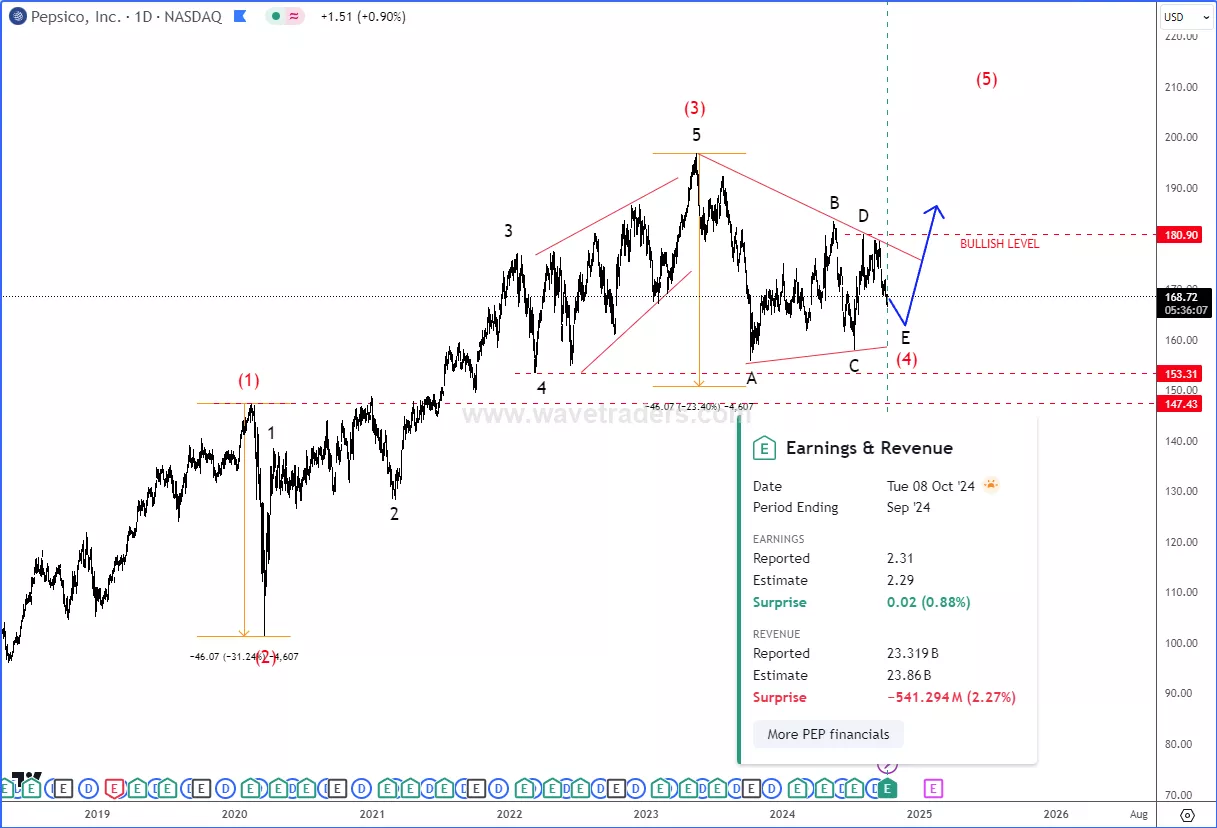
A triangle appears to reflect a balance of forces, causing a sideways movement that is usually associated with decreasing volume and volatility. The triangle pattern contains five overlapping waves that subdivide 3-3-3-3-3 and are labeled A-B-C-D-E. The triangle is a region of horizontal price movement, a consolidation of a prior move, and it is composed of “threes.” That means each of the A-B-C-D-E waves have three subwaves. The triangle pattern is generally categorized as a continuation pattern, meaning that after the pattern completes, it’s assumed that the price will continue in the trend direction it was moving before the pattern appeared. However, triangles also indicate that the final leg is coming before a reversal and that’s why triangles are labeled in wave B, wave X or wave 4.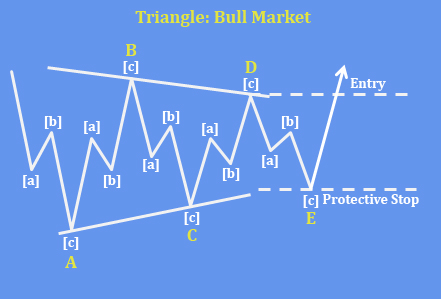 How to trade a bullish triangle? Ideal entry is on the break above previous wave D with protective stops below wave E.More By This Author:
PepsiCo Is Finishing A Bullish Triangle

