NZD/CAD dropped again in the short term but the support holds for now, so it could develop an upside movement. It is moving decidedly sideways right now, as it tries to attract more buyers into the game.
Surprisingly or not, CAD is still bearish in the short term even if the Canadian CPI was reported better than expected. The indicator remained steady at 0.5%, even if the specialists had expected only a 0.4% growth. The Core CPI increased by 0.4% versus 0.5% in the former reporting period, while the Wholesale Sales reading increased by 0.4% beating -1.0% expectations.
Canadian inflation is currently at 3.5%, having accelerated for the second month in a row. Housing costs and car prices are driving some of the increase. Shipping expenses and delays are adding to costs, a factor that has come into the picture in the US, where second-hand car prices have risen markedly as new vehicles are in short supply.
The Canadian economy is currently in lockdown, so expectations for inflation to continue to accelerate may have to be taken into account when the economy eventually begins to open up.
New Zealand releases its GDP data tomorrow – the economic indicator is expected to increase by 0.5%. Also, better-than-expected Australian economic data could help the NZD to resume its growth versus its rivals.
NZD/CAD: technical analysis
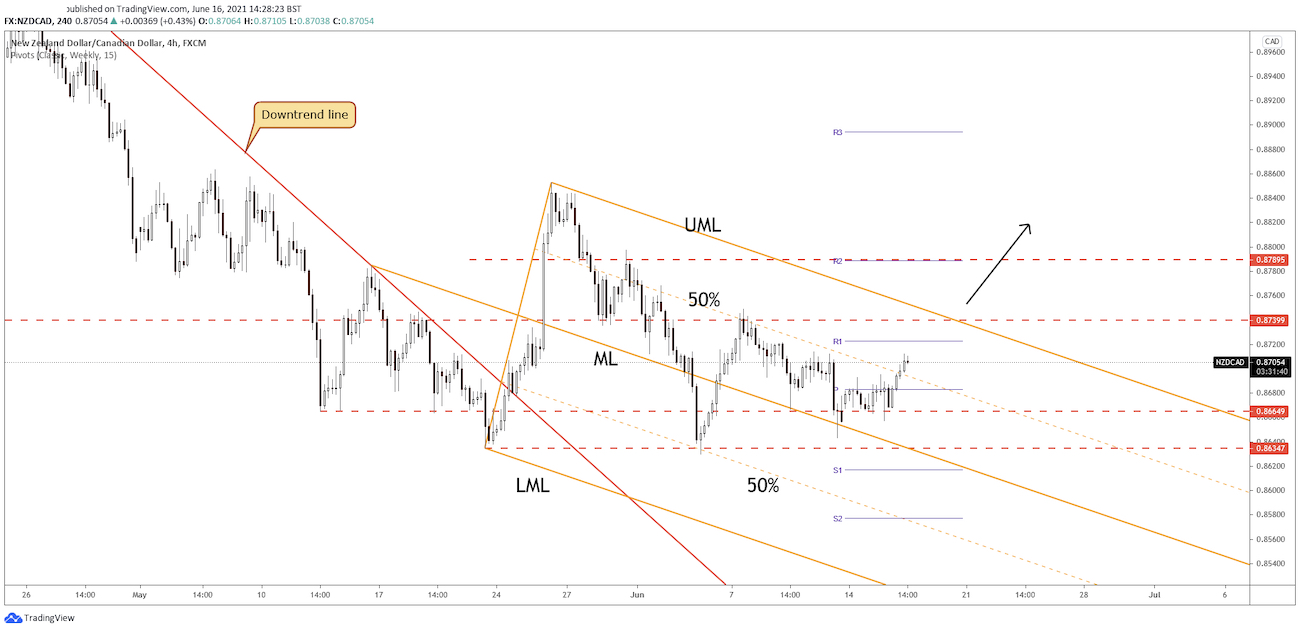
NZD/CAD has found strong support between 0.8634 and 0.8664 levels. Now it is traded higher at 0.8699 and it could resume its rebound if it stays above the descending pitchfork’s upside 50% Fibonacci line.
The pair could test and retest this broken dynamic resistance better than expected Canadian CPI. Technically, it could increase after failing to close again under the median line (ML) or to approach the 0.8634 support again.
Still, a larger growth could be signalled by a valid breakout above the R1 (0.8722) and through the descending pitchfork’s upper median line (UML). In the short term, we cannot exclude the pivot point 0.8682 retest.
Moving sideways and breaking above the upper median line (UML) could signal a potential upside reversal. It could turn to the upside as long as 0.8664 – 0.8634 support zone holds.
Get Free Forex Signals – 82% Win Rate!
3 Free Forex Signals Every Week – Full Technical Analysis


