Labor share data going back many years was revised last week. According to these new revisions, the economy has been against the effective demand limit since the beginning of the year. With the stock markets retreating from their record highs, this should not be surprising.
Keep in mind that the updated graphs below are based on my own theory of effective demand…
The effective demand limit determines true slack in the economy. Productive capacity is not established by what we should be able to produce, but by the relative strength of demand to purchase production.
The effective demand limit says that the combined utilization rates of labor and capital will not surpass an effective labor share. Therefore, slack in the economy is determined by…
slack = effective labor share – (capacity utilization * (1 – unemployment rate)) > 0
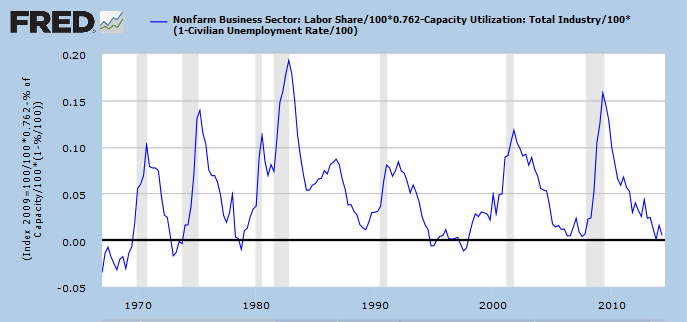
The UT index
The UT index is a measure of the slack (Unused Total capacity of labor and capital). Here is a graph of the UT index since 1967.

The UT index wants to stay above 0%. Firms (in the aggregate) do not increase profits when slack goes negative, because firms will pay the increased cost of employing more labor and capital, instead of consumers paying that cost.
The UT index shows that slack has been at the zero lower bound since the end of 2013. It bounced on 0% in the 4thQ of 2013 and is now hovering above 0%. … So how has unemployment been able to decline in 2014 if slack is zero? Well, labor share has risen off of its low at the end of 2013. There is more relative consumer power from labor.
If labor share stays constant though, unemployment and capacity utilization will be capped. That is to say… the unemployment rate will only mildly decline, and capacity utilization will stay constant or decline. That has been a normal pattern in past business cycles.
I project that within the next 4 quarters, the UT index will start rising as it did in previous business cycles. You might wonder why slack would start increasing during a business cycle. The reason is that a recession is forming, profit rates are dropping and firms start employing less labor and capital.
