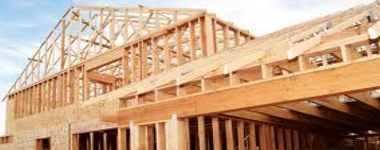
Residential building data continues to show relative strength – but this strength is in multi-family housing. The rolling averages are the best metric to view this series – and the rolling averages continue to accelerate. This data was well above expectations.

Â
Be careful in looking at this data set with a microscope as the potential error ranges and backward revisions are significant. Using rolling averages likely is the best way to view this series – and one gets the sense this month that the data is returning to the range we have seen over the last 3 years (after several months of nasty data).
- The unadjusted rate of annual growth for building permits in the last 12 months has been around 10% – it is 20.8% this month.
- Unadjusted 3 month rolling averages for permits (comparing the current averages to the averages one year ago) show that construction completions are lower than permits this month for the second month in a row.
3 month Rolling Average for Year-over-Year Growth Unadjusted Data
| Â | Building Permits | Construction Completions |
| Current Movement | accelerating | accelerating |
Unadjusted 3 Month Rolling Average of Year-over-Year Growth – Building Permit (blue line) and Construction Completions (red line)

Â
Econintersect Analysis:
- Building permits growth accelerated 15.0% month-over-month, and is up20.8% year-over-year.
- Single family building permits improved 4.0% year-over-year – so permit growth is from multi-family.
- Construction completions decelerated 3.6% month-over-month, up 15.7% year-over-year.
US Census Headlines:
- building permits up 11.8% month-over-month, up 25.4% year-over-year
- construction completions up 4.7% month-over-month, up 14.5% year-over-year.
- the market expected:
| Annual Rates | Consensus Range | Consensus | Actual |
| Housing Starts | 1.044 M to 1.155 M | 1.090 M | 1.275 M |
| Housing Permits | 1.065 M to 1.200 M | 1.105 M | 1.036 M |
Note that Econintersect analysis herein is based on UNADJUSTED data – not the headline seasonally adjusted data.
When more building permits are issued than residences completed – the industry is expanding – and this expansion was underway for three years (except for the last two months in 2014). In the graph below, any value above zero shows more permits are being issued than completions.
