Anyone who follows the mainstream financial press is seeing an increasing number of articles about bear market risk. Today’s Bloomberg guest piece by Barry Ritholtz is a classic example:Â Signs of a Bull Market Turning Bear.
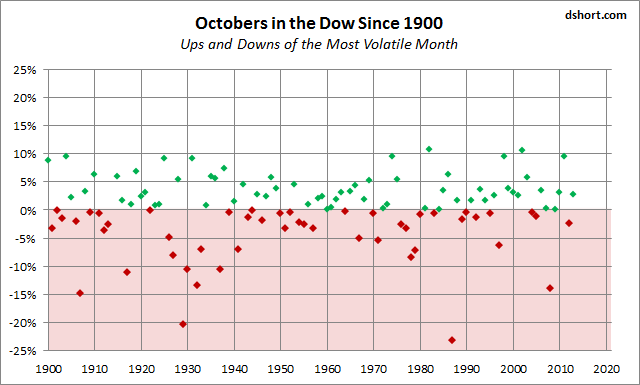
The growth in investor anxiety is happening in October, historically the most volatile month for market performance. I took a few minutes to update a couple of charts to illustrate October volatility using the Dow and starting in 1900. So we can see 114 October gains and losses.
Here is a look at the data in a chronological sequence.

Here are the same percentages sorted from low to high.

As we can see, the Dow October average over this timeframe is a modest 0.20%. There have been 64 monthly gains and 49 monthly losses. That’s calculates as a gain about 57% of the time. Note that the outbreak of WWW I in 1914 prompted the closure of US markets from July 31 to November 28.
But the range is truly remarkable, from the 10.65% surge in 1982 to the -23.22% rout in 1987, which included the -22.61% cliff-dive on October 19th, known as Black Monday.
As I type this, the October Dow is down 1.67%, the S&P 500 is down 1.77% and the Russell 2000 is down 2.68%.
Time will tell!

