To say last week was a rough one for the market would be an understatement.  It was the biggest weekly loss we’ve seen since 2012, and perhaps worse than that, it really got traders wondering if stocks are far more vulnerable than they may have first thought.  And sometimes, that doubt can be more dangerous than any technical or fundamental problems the market may be facing.
We’ll dissect all of it below, beginning with our usual look at key economic numbers.Â
Economic Calendar
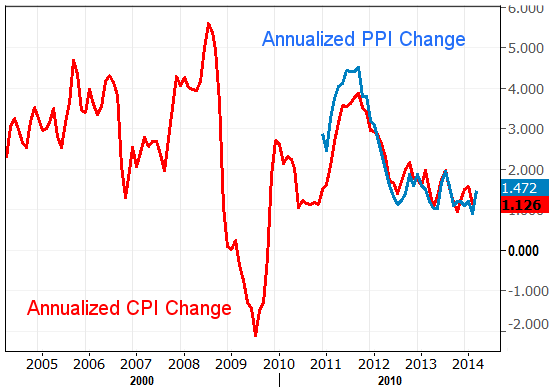
As we mentioned last week, there wasn’t much in the economic data lineup last week, and little of that was important.  The only thing that was of any real interest was Friday’s producer price inflation.  We’re finally seeing some much-needed inflationary pressure; as of last month the annualized producer inflation rate stands at 1.4%.  It’s a small hint that there’s finally some pricing power – a hint of economic strength – for suppliers and manufacturers (yet it’s not at debilitating levels – it’s at a healthy balance).  The picture will be completed this week when we get the consumer inflation data, though the feeling is that it too will show a modest perk-up towards healthier levels.Â
Inflation Trends Chart
Source:Â Â Bureau of Labor Statistics
Economic Calendar
Source: Â Briefing.com.
You can see that this week will be a little busier this month, with a handful of these items capable of moving the market … IF traders can look past the panic selling that may continue after Thursday’s and Friday’s meltdown.
The fireworks start on Monday morning, with March’s retail sales. Â The pros are looking for some noteworthy strength here too, with spending expected to be up 0.5% without cars, and up a solid 1.0% when factoring automobiles into the equations. Â As you can see on the chart of year-over-year changes in retail spending below, we’re still in net-positive territory here, but it’s not strong annualized growth.

