Even with last week’s losses, there’s a glimmer of hope for this overbought market.  And with the onset of earnings season, anything is still possible.  Just know that the deck is still stacked against stocks here.  They reminded everyone last week that no rally can last forever.  The good news is, there are some clear lines in the sand we can use to spot the eventual market pullback that’s on the horizon.
We’ll discuss those milestones on a moment. Â The first items we need to cross off our to-do list are this week’s economic announcements.Â
Earnings Calendar
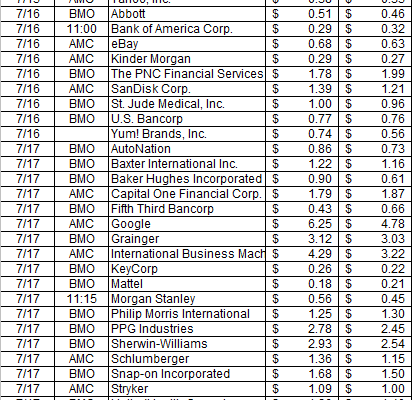
It’s that time of year again. While earnings season officially started last week, it’s this week we start getting several key earnings announcements every day… enough to really move the market. Just to help you keep track, here’s a calendar of the major ones in the queue for this week.
Earnings Calendar
Source: Â Briefing.com
Economic Analysis
We mentioned a week ago that last week’s economic data dance card was oddly empty, and it’s not as if those low expectations were exceeded. Â Indeed, there wasn’t even one single data nugget worth charting from last week. Â Take a look.
Economic Calendar
Source: Â Briefing.com
This week’s economic data calendar is considerably fuller, as you can see.  In fact, some of it is so important we actually want to go ahead and show you the charts through last month’s figures, just so you have some context heading into the official unveilings.  In order of appearance…
The party starts on Tuesday with June’s retail sales.  As you can see on the chart, year-over-year retail spending is still positive, but the pace of growth since 2011 is gradually subsiding.  The pros are expecting a very strong retail spending surge for June, with or without automobiles.
Retail Spending Trends Chart
Source: Â Thomson Reuters Eikon

