Remember “knifed at a bus stop“?
The whole idea with that post was to set up a chart that showed the three times when banks, energy shares, and big cap tech all declined by 1% (basically) or more on the same day in 2017.
Somehow, it ended up involving a story about a guy getting T-boned at an intersection, fired by his boss, and then stabbed while trying to catch the bus home. That’s indicative of how these posts sometimes go off the rails and it’s part of what makes the Heisenberg brand so great.
Anyway, the point was that when everything goes to hell in a handbasket – as opposed to just one or two things going to hell in a handbasket – well then you’ve got a problem. One of the things that kept vol. suppressed in 2017 was record low correlations between stocks and as Marko Kolanovic noted in December, one of the best examples of that dynamic was the late November tech rout:
Perhaps the best example of the impact of correlation on reducing S&P 500 volatility was the market move on Nov 29, when financials and technology stocks moved ~4% relative to each other leaving the S&P 500 index price unchanged (~5 sigma move).
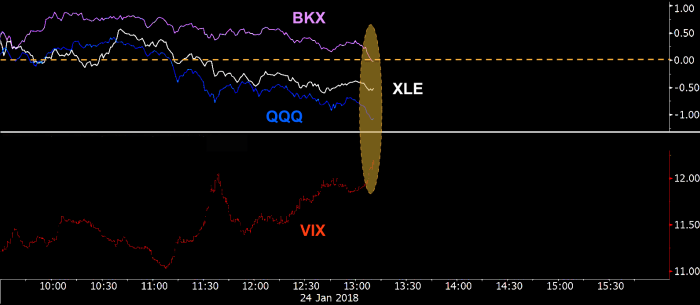
So long story short, you want to watch for days when it all falls apart simultaneously and one way to monitor that is to check out the banks index, XLE, and QQQ.
Although things have stabilized since, it’s worth noting that on Wednesday, they were all in the red at one point and that of course coincided with a spike in the VIX:

Â
The dip buyers seem to have surfaced since, but nevertheless, it’s worth keeping an eye on this because the only three times the bank index, XLE and big-cap tech all fell 1% or more in the same day in 2017, something had gone “wrong†on the policy/political front.
In order: Comey, “fire and fury†fallout, Gary Cohn resignation rumor:

Â
Needless to say, all the “trade war†talk represents a new geopolitical hurdle.

