
A Federal Reserve data release (Z.1 Flow of Funds) for 1Q2015 – which provides insight into the finances of the average household – shows a modest improvement in average household net worth. Our modeled “Joe Sixpack” – who owns a house and has a job, and essentially no other asset – is better off than he was last quarter.

You may ask why this analysis is important? It looks at the financial health of the consumer – and in a consumption based economy, it measures the dynamics affecting the consumer.
What is concerning is that the 35% of Americans who have no home or assets are no better off (living from paycheck to paycheck) – and have no path to consume more. This person is not modeled by this index.
First, from the Z.1 Flow of Funds report, what was shown about Household Net Worth and Growth of Domestic Nonfinancial Debt. Cumulative Household net worth improved modestly, while cumulative household debt growth declined significantly.

Â
The Joe Sixpack Index
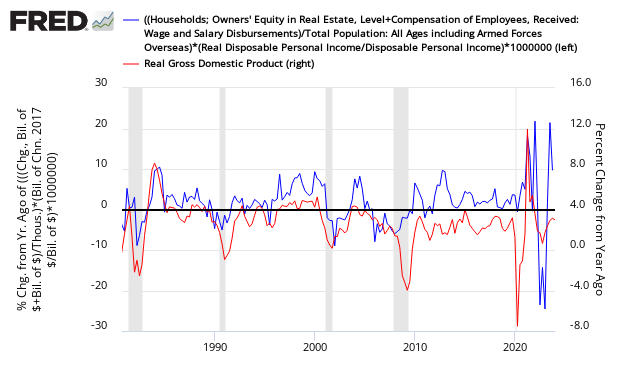
The Joe Sixpack Index is a composite index of home prices and wage income (again – Joe owns a house, has a job, and no other assets). This index was designed to measure how rich Joe should feel. The theory is that the richer Joe feels, the more Joe will spend.
- The data in this index is only updated every three months, and the data was updated with the release of the Federal Reserves Z.1 Flow of Funds.
- It is inflation and population adjusted.
- Currently, Joe has a house that is increasing in value – and his income in inflation terms grew – so the net affect is that the index improved – and now indicates Joe feels richer than he did in the last quarter. If Joe is not feeling richer, it is unlikely spending will increase. The stage is set for greater consumer spending.
Joe Sixpack Index (blue line, left axis) shown against GDP (red line, right axis)
Â
The Middle Man Index
The middle class household with financial assets and real estate assets is Middle Man. A Federal Reserve Publication shows the percentage of households owning various financial assets. Other than real estate, Middle Man holds transaction accounts (checking – 1% of all financial assets) and retirement accounts (roughly estimated by Econintersect at 25% of household financial assets).
