It’s Too Soon To Buy Gold-Elliott Wave Chart
Hello traders!
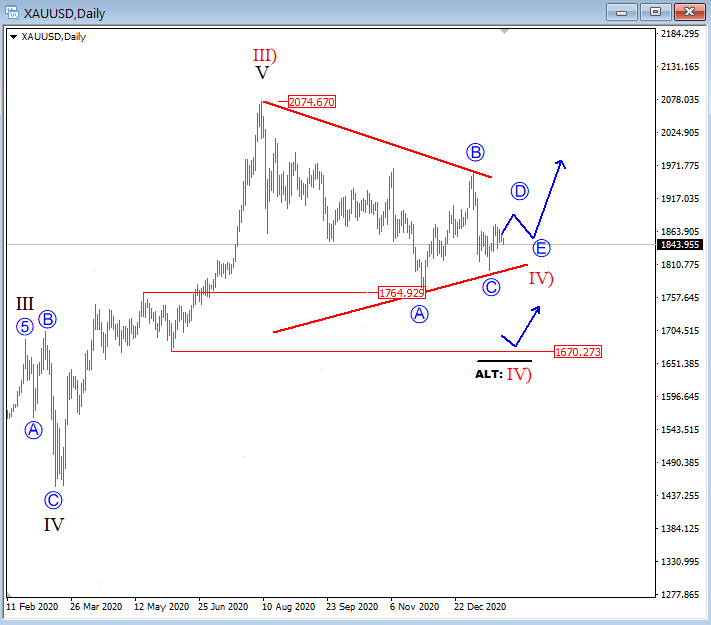
After the recent strong and impulsive rally on gold, we can see it slowing down now since the August 2020 high, but with slow and overlapping price action, so we think it’s a corrective wave structure, seen as higher degree wave IV correction. Wave IV can be sometimes very complex, so at this stage, we are observing two counts especially since the USD is trying to recover which may have a bearish impact on metals as well.
In the first and primary chart below, we are tracking a bigger bullish triangle correction in wave IV), but only if the price stays slow and sideways until we see an A-B-C-D-E subwaves. This is possible if the metal will keep chopping around between around 1850-1900. If not, and if bears will be in charge for the next few weeks with a potential retest of 1765 then secondary count comes in play, where we may see deeper and more complex 7-swing A-B-C-X-A-B-C correction. In such a case 1700 can be a very important level to watch for the next bounce.
So for now, gold remains very tricky, but what I like about the whole price action down from August highs is that in either case, it’s corrective, we just need more time now before we can decide what type of patter wave four is forming., But eventually, price will be higher later this year.
If you are looking at gold in EUR, then you should also be aware of potential weakness as the price can be breaking a bearish flag.
XAUUSD 1 and 2
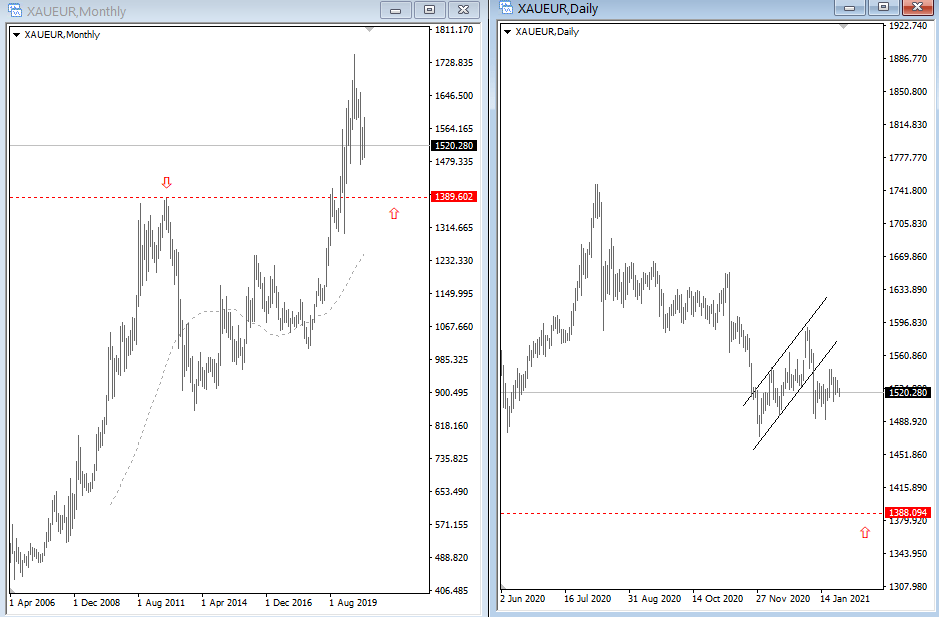
XAUEUR
Trade well!


