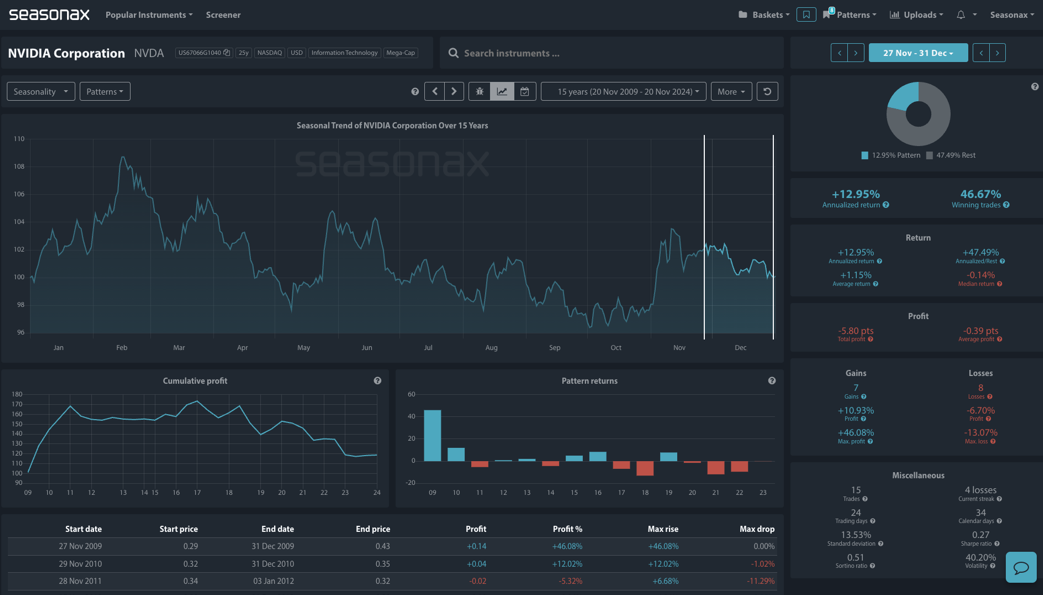
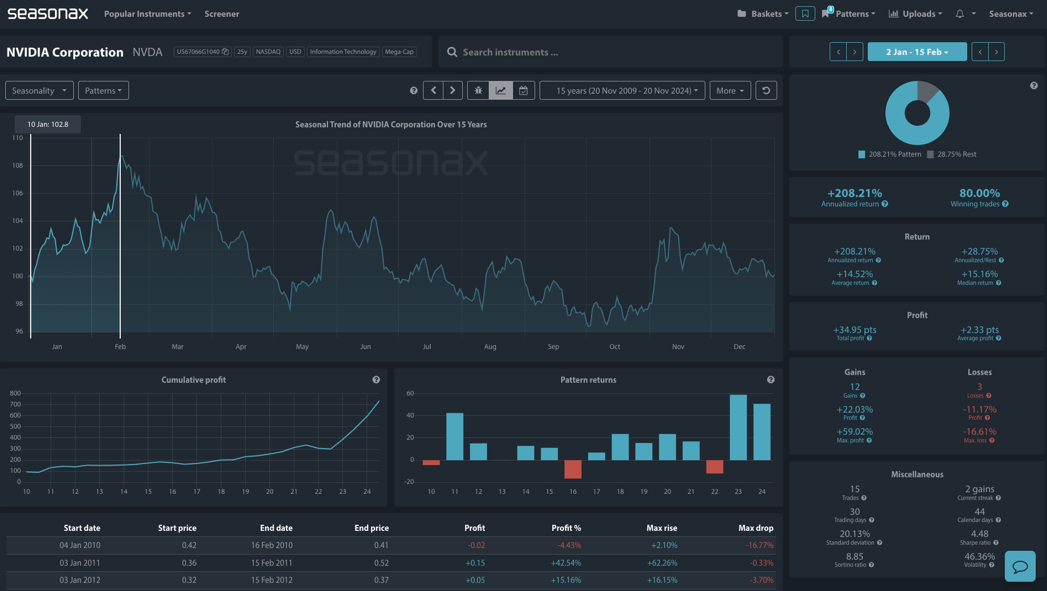
Nvidia unveiled strong fiscal Q3 results, with a 94% revenue jump to $35.1 billion, driven by AI-fueled demand for its chips. However, its forecast for Q4 sales of $37.5 billion fell short of some Wall Street expectations. The launch of its new Blackwell chips has strained margins, though production is ramping up to meet high demand. The company’s data center division, which doubled revenue to $30.8 billion, remains heavily reliant on a few cloud providers. Despite challenges, Nvidia’s dominance in AI and chip markets continues to soar.Seasonax shows that the seasonal pattern for Nvidia is weak now into year end. The average return is 1.15% and there have been 7 gains and 8 losses over the last 15 years. The earnings report last week was greeted by a mixed market response, so does that speak of noncommittal price action into year end?(Click on image to enlarge) Now the seasonal pattern for the new year is altogether more interesting for buyers. Over the last 15 years we see an average return of over 14% from January 2 through to February 15 with quite an even distribution of returns and a really good recent run. Last year and this year both saw gains of over 50%! See below for the pattern.(Click on image to enlarge)
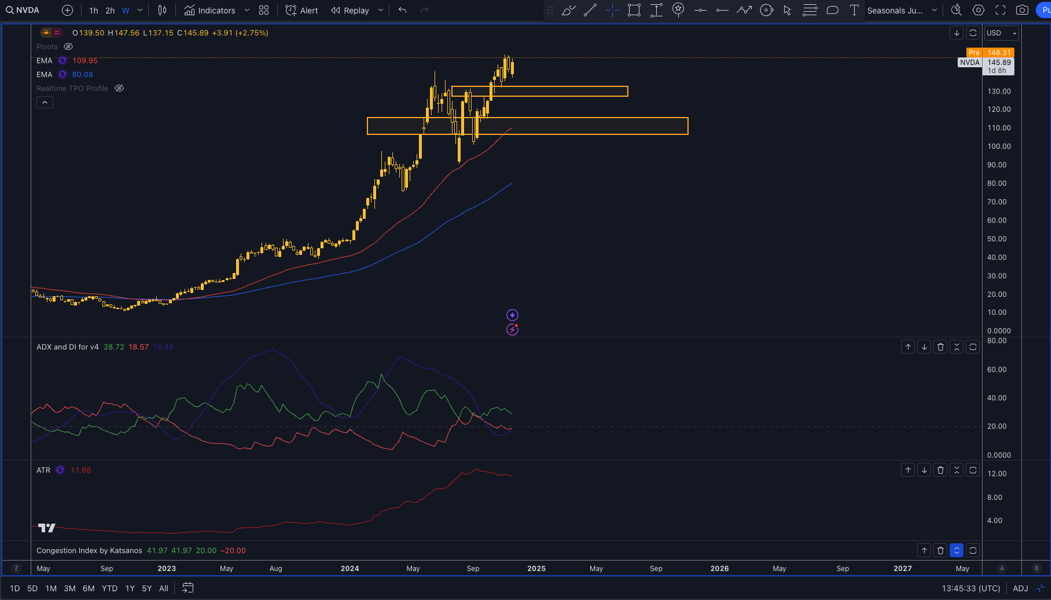
 Technically, there are major support levels at 115 and 130 on the weekly chart. Are they good entry levels ahead of January’s strong seasonal pattern?(Click on image to enlarge)
 Trade risks
There are quite a few risks from AI chip news, production speed of Blackwell chips, and the market’s general view on AI as well as Fed policy.Video Length: 00:02:27More By This Author:Is December The Time For A EURUSD Bounce? Can Strong Seasonals Keep Bitcoin’s Run Going? How Much Lower Could Wednesday’s UK CPI Print Sink The GDP?
Is Nvidia A ‘Buy The Dip’ Post Earnings?

