Today’s better than expected jobs number helped hoist most of the major averages to new highs…and pushed the volatility index (VIX) to a low not seen since the beginning of 2007. While historically the VIX has shown that it can stay at depressed levels for a while, there is an indication that it may not be hanging out here for much longer.
VVIX/VIX divergence
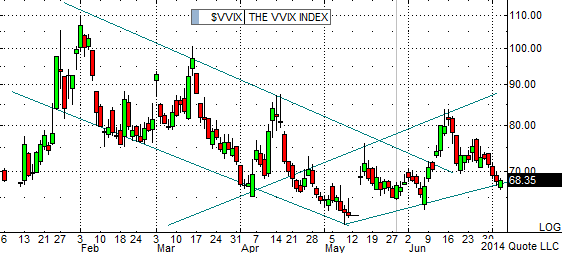
The VIX volatility index (VVIX) is a measure of the implied volatilities of the options that make up the VIX. It is an indicator of the expected volatility of the 30-day forward price of the VIX. The VIX and the VVIX usually move in concert with each other but lately there’s been a divergence in direction.
The charts below show that from the beginning of February to mid-May the general trend of both indices was down. Since then, the VIX has continued its downward trend but the VVIX seems to have reversed course and appears to be trending in the opposite direction. While this could be just a temporary phenomenon that may be explained by the differences between the underlying models involved in the calculation of each index, it could also mean that the era of the ultra-low VIX and an ever rising market is coming to an end.
Not to rain on anyone’s Fourth of July picnic, but it might behoove long-term investors to consider buying put protection as a hedge especially since options are at fire sale prices. Remember, it’s better to carry an umbrella and not have to use it than to be caught without one in a sudden downpour.
Â

Â

