Insider buying declined last week with insiders buying $42.41 million of stock compared to $115.81 million in the week prior. Selling also decreased with insiders selling $910.43 million of stock last week compared to $2.29 billion in the week prior.
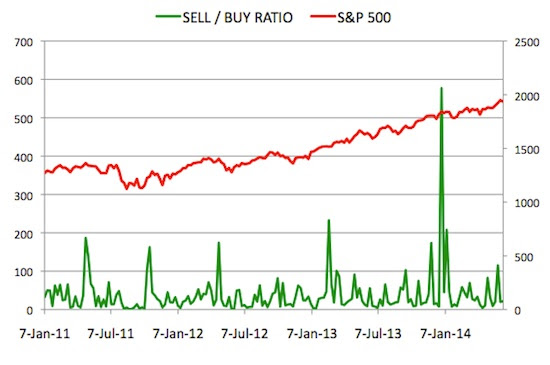
Sell/Buy Ratio: The insider Sell/Buy ratio is calculated by dividing the total insider sales in a given week by total insider purchases that week. The adjusted ratio for last week went up to 21.47. In other words, insiders sold more than 21 times as much stock as they purchased. The Sell/Buy ratio this week compares unfavorably with the prior week, when the ratio stood at 19.77.
We are calculating an adjusted ratio by removing transactions by funds and companies and trying as best as possible only to retain information about insiders and 10% owners who are not funds or companies.

Insider Sell Buy Ratio June 13, 2014
Note: As mentioned in the first post in this series, certain industries have their preferred metrics such as same store sales for retailers, funds from operations (FFO) for REITs and revenue per available room (RevPAR) for hotels that provide a better basis for comparison than simple valuation metrics. However metrics like Price/Earnings, Price/Sales and Enterprise Value/EBITDA included below should provide a good starting point for analyzing the majority of stocks.
Notable Insider Buys:
1. Endurance Specialty Holdings Ltd. (ENH): $51.63
Chairman & Chief Executive Officer John Charman acquired 35,630 shares of this insurance company for a total amount of $1.46 million. 15,300 of these shares were preferred shares purchased for $26.69/share and 20,330 were ordinary shares purchased for $51.71/share. These shares were purchased indirectly by various trusts.
You can view the list of recent insider transactions for Endurance Specialty Holdings Ltd. here.
| P/E: 8.05 | Forward P/E: 9.49 | Industry P/E: 13.52 |
| P/S: 1.06 | Price/Book: 0.77 | EV/EBITDA: 4.91 |
| REITs: $2.31B | Avg. Daily Volume: 314,700 | 52 Week Range: $47.99 – $58.83 |
2. Calamos Asset Management Inc. (CLMS): $13.17
